CAT 1998 — DILR
All 51 DILR questions from CAT 1998, with the answer key and detailed solutions. Practise free — check answers as you go, or tap Show solution.
CAT 1998 · DILR
Direction: In the question below, the main statement is followed by four sentences. Select the pair of sentences that relates logically to the given statement.
Either Sita is sick or she is careless.
A. Sita is not sick.
B. Sita is not careless.
C. Sita is sick.
D. Sita is careless.
Direction: In the question below, the main statement is followed by four sentences. Select the pair of sentences that relates logically to the given statement.
Ram gets a swollen nose whenever he eats hamburgers.
A. Ram gets a swollen nose.
B. Ram does not eat hamburgers.
C. Ram does not get a swollen nose.
D. Ram eats hamburgers.
Direction: In the question below, the main statement is followed by four sentences. Select the pair of sentences that relates logically to the given statement.
Either the employees have no confidence in the management or they are hostile by nature.
A. They are not hostile by nature.
B. They are hostile by nature.
C. They have confidence in the management.
D. They have no confidence in the management.
Direction: In the question below, the main statement is followed by four sentences. Select the pair of sentences that relates logically to the given statement.
Whenever Ram reads late into the night, his father beats him.
A. His father does not beat Ram.
B. Ram reads late into the night.
C. Ram reads early in the morning.
D. Ram's father beats him in the morning.
Direction: In the question below, the main statement is followed by four sentences. Select the pair of sentences that relates logically to the given statement.
All irresponsible parents shout if their children do not cavort.
A. All irresponsible parents do not shout.
B. Children cavort.
C. Children do not cavort.
D. All irresponsible parents shout.
Direction: The question contains four arguments of three sentences each. Choose the set in which the third statement is a logical conclusion of the first two.
A. Some Xs are Ps. Some Ps are Ys. Some Xs are Ys.
B. All Sonas are bright. Some bright are crazy. Some Sonas are crazy.
C. No faith is strong. Only strong have biceps. No faith has biceps.
D. All men are weak. Some weak are strong. Some strong are weak.
Direction: The question contains four arguments of three sentences each. Choose the set in which the third statement is a logical conclusion of the first two.
A. Some icicles are cycles. All cycles are men. Some icicles are men.
B. All girls are teeth. No teeth is yellow. No girls are yellow.
C. No hand is foot. Some foot are heads. Some hands are heads.
D. Every man has a wife. All wives are devoted. No devoted has a husband.
Direction: The question contains four arguments of three sentences each. Choose the set in which the third statement is a logical conclusion of the first two.
A. No sun is not white. All moon is sun. All moon is white.
B. All windows are open. No open space is allocated. All window is closed space.
C. No German can fire. All Americans bombard. Both, Germans and Americans can fight.
D. No X is Z. No Z is Y. No X is Y.
Direction: The question contains four arguments of three sentences each. Choose the set in which the third statement is a logical conclusion of the first two.
A. All Ts are square. All squares are rectangular. All Ts are rectangular.
B. Some fat are elongated. Some elongated things are huge. Some fat are huge.
C. Idiots are bumblers. Bumblers fumble. Idiots fumble.
D. Water is good for health. Health foods are rare. Water is rare.
Direction: Answer the questions based on the following information.
Mr Bankatlal acted as a judge for the beauty contest. There were four participants, viz. Ms Andhra Pradesh, Ms Uttar Pradesh, Ms West Bengal and Ms Maharashtra. Mrs Bankatlal, who was very anxious about the result, asked him about it as soon as he was back home. Mr Bankatlal just told that the one who was wearing the yellow saree won the contest. When Mrs Bankatlal pressed for further details, he elaborated as follows:
- All of them were sitting in a row.
- All of them wore sarees of different colours, viz. green, yellow, white, red.
- There was only one runner-up and she was sitting beside Ms. Maharashtra.
- The runner-up was wearing the green saree.
- Ms West Bengal was not sitting at the ends and was not the runner up.
- The winner and the runner-up are not sitting adjacent to each other.
- Ms Maharashtra was wearing white saree.
- Ms Andhra Pradesh was not wearing the green saree.
- Participants wearing yellow saree and white saree were at the ends.
Who wore the red saree?
Direction: Answer the questions based on the following information.
Mr Bankatlal acted as a judge for the beauty contest. There were four participants, viz. Ms Andhra Pradesh, Ms Uttar Pradesh, Ms West Bengal and Ms Maharashtra. Mrs Bankatlal, who was very anxious about the result, asked him about it as soon as he was back home. Mr Bankatlal just told that the one who was wearing the yellow saree won the contest. When Mrs Bankatlal pressed for further details, he elaborated as follows:
- All of them were sitting in a row.
- All of them wore sarees of different colours, viz. green, yellow, white, red.
- There was only one runner-up and she was sitting beside Ms. Maharashtra.
- The runner-up was wearing the green saree.
- Ms West Bengal was not sitting at the ends and was not the runner up.
- The winner and the runner-up are not sitting adjacent to each other.
- Ms Maharashtra was wearing white saree.
- Ms Andhra Pradesh was not wearing the green saree.
- Participants wearing yellow saree and white saree were at the ends.
Ms. West Bengal was sitting adjacent to
Direction: Answer the questions based on the following information.
Mr Bankatlal acted as a judge for the beauty contest. There were four participants, viz. Ms Andhra Pradesh, Ms Uttar Pradesh, Ms West Bengal and Ms Maharashtra. Mrs Bankatlal, who was very anxious about the result, asked him about it as soon as he was back home. Mr Bankatlal just told that the one who was wearing the yellow saree won the contest. When Mrs Bankatlal pressed for further details, he elaborated as follows:
- All of them were sitting in a row.
- All of them wore sarees of different colours, viz. green, yellow, white, red.
- There was only one runner-up and she was sitting beside Ms. Maharashtra.
- The runner-up was wearing the green saree.
- Ms West Bengal was not sitting at the ends and was not the runner up.
- The winner and the runner-up are not sitting adjacent to each other.
- Ms Maharashtra was wearing white saree.
- Ms Andhra Pradesh was not wearing the green saree.
- Participants wearing yellow saree and white saree were at the ends.
Which saree was worn by Ms Andhra Pradesh?
Direction: Answer the questions based on the following information.
Mr Bankatlal acted as a judge for the beauty contest. There were four participants, viz. Ms Andhra Pradesh, Ms Uttar Pradesh, Ms West Bengal and Ms Maharashtra. Mrs Bankatlal, who was very anxious about the result, asked him about it as soon as he was back home. Mr Bankatlal just told that the one who was wearing the yellow saree won the contest. When Mrs Bankatlal pressed for further details, he elaborated as follows:
- All of them were sitting in a row.
- All of them wore sarees of different colours, viz. green, yellow, white, red.
- There was only one runner-up and she was sitting beside Ms. Maharashtra.
- The runner-up was wearing the green saree.
- Ms West Bengal was not sitting at the ends and was not the runner up.
- The winner and the runner-up are not sitting adjacent to each other.
- Ms Maharashtra was wearing white saree.
- Ms Andhra Pradesh was not wearing the green saree.
- Participants wearing yellow saree and white saree were at the ends.
Who was the runner-up?
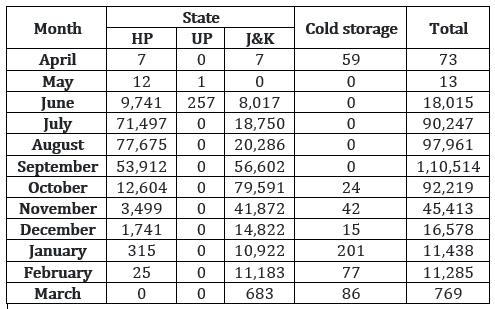
Direction: The following table gives the quantity of apples (in tonnes) arriving at
New Delhi market from various states in a particular year. The month in which demand was more than supply, the additional demand was met by the stock from cold storage.
 âââââââ
What was the maximum percentage of apples supplied by any state in any of the months?
Direction: The following table gives the quantity of apples (in tonnes) arriving at
New Delhi market from various states in a particular year. The month in which demand was more than supply, the additional demand was met by the stock from cold storage.
âââââââ
Which state supplied the maximum number of apples?
Direction: The following table gives the quantity of apples (in tonnes) arriving at
New Delhi market from various states in a particular year. The month in which demand was more than supply, the additional demand was met by the stock from cold storage.
âââââââ
Which state supplied the highest percentage of apples from the total apples supplied?
Direction: The following table gives the quantity of apples (in tonnes) arriving at
New Delhi market from various states in a particular year. The month in which demand was more than supply, the additional demand was met by the stock from cold storage.
âââââââ
In which of the following periods was the supply greater than the demand?
Direction: The following table gives the quantity of apples (in tonnes) arriving at
New Delhi market from various states in a particular year. The month in which demand was more than supply, the additional demand was met by the stock from cold storage.
âââââââ
If the yield per tree was 40 kg, then from how many trees were the apples supplied to New Delhi (in millions) during the year?
Direction: The following table gives the quantity of apples (in tonnes) arriving at
New Delhi market from various states in a particular year. The month in which demand was more than supply, the additional demand was met by the stock from cold storage.
âââââââ
Using the data in previous question, if there were 250 trees per hectare, then how many hectares of land was used?
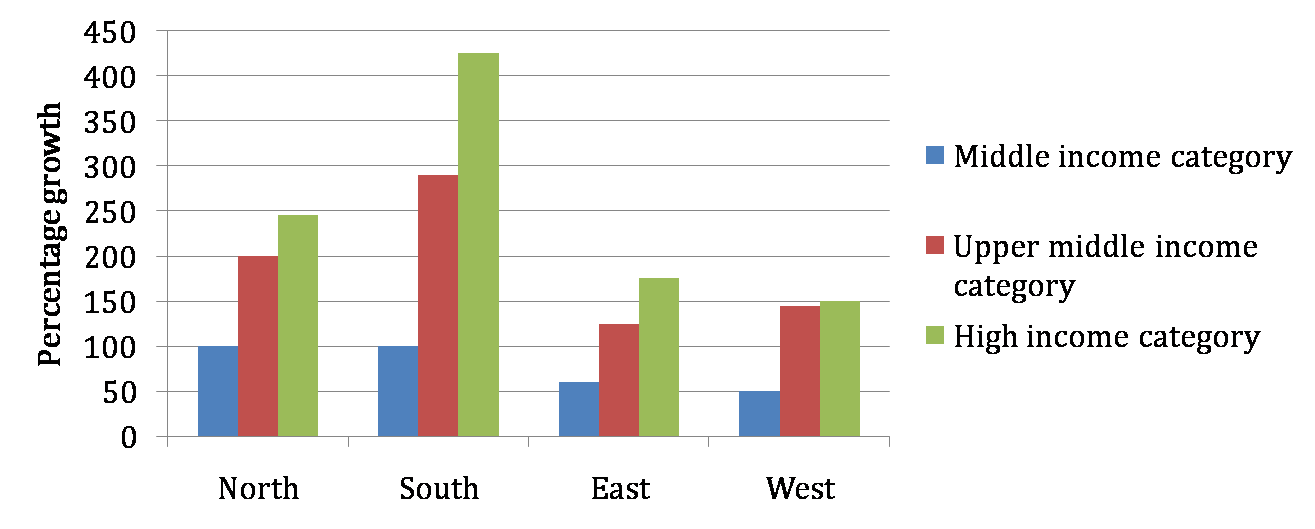
Direction: Answer the questions based on the following information.
The following bar chart gives the growth percentage in the number of households in middle, upper-middle and high income categories in the four regions for the period between 1987-88 and 1994-95.
 âââââââ
Which region showed the highest growth in number of households in all the income categories for the period?
Direction: Answer the questions based on the following information.
The following bar chart gives the growth percentage in the number of households in middle, upper-middle and high income categories in the four regions for the period between 1987-88 and 1994-95.
âââââââ
What was the total household income in northern region for upper-middle class?
Direction: Answer the questions based on the following information.
The following bar chart gives the growth percentage in the number of households in middle, upper-middle and high income categories in the four regions for the period between 1987-88 and 1994-95.
âââââââ
What is the percentage increase in total number of households for the northern region (upper-middle) over the given period?
Direction: Answer the questions based on the following information.
The following bar chart gives the growth percentage in the number of households in middle, upper-middle and high income categories in the four regions for the period between 1987-88 and 1994-95.
âââââââ
What was the average income of the high-income group in 1987-88?
Direction: Answer the questions based on the following information.
The following bar chart gives the growth percentage in the number of households in middle, upper-middle and high income categories in the four regions for the period between 1987-88 and 1994-95.
âââââââ
Additional direction: The numbers of households in each category were equally distributed in all the regions.
The ratio of total income for the high-income category to the upper-middle class increased by how much percentage in the given period?
Direction: Answer the questions based on the following information.
The following bar chart gives the growth percentage in the number of households in middle, upper-middle and high income categories in the four regions for the period between 1987-88 and 1994-95.
âââââââ
Additional direction: The numbers of households in each category were equally distributed in all the regions.
The average income for the northern region in 1987-88 was
Direction: Answer the questions based on the following information.
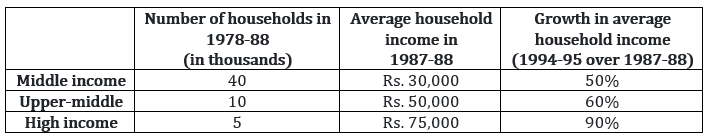
Krishna distributed 10-acre land to Gopal and Ram who paid him the total amount in the ratio 2 : 3. Gopal invested a further Rs. 2 lakh in the land and planted coconut and lemon trees in the ratio 5 : 1 on equal areas of land. There were a total of 100 lemon trees. The cost of one coconut was Rs. 5. The crop took 7 years to mature and when the crop was reaped in 1997, the total revenue generated was 25% of the total amount put in by Gopal and Ram together. The revenue generated from the coconut and lemon trees was in the ratio 3 : 2 and it was shared equally by Gopal and Ram as the initial amount spent by them were equal.
What was the total output of coconuts?
Direction: Answer the questions based on the following information.
Krishna distributed 10-acre land to Gopal and Ram who paid him the total amount in the ratio 2 : 3. Gopal invested a further Rs. 2 lakh in the land and planted coconut and lemon trees in the ratio 5 : 1 on equal areas of land. There were a total of 100 lemon trees. The cost of one coconut was Rs. 5. The crop took 7 years to mature and when the crop was reaped in 1997, the total revenue generated was 25% of the total amount put in by Gopal and Ram together. The revenue generated from the coconut and lemon trees was in the ratio 3 : 2 and it was shared equally by Gopal and Ram as the initial amount spent by them were equal.
What was the value of output per acre of lemon trees planted?
Direction: Answer the questions based on the following information.
Krishna distributed 10-acre land to Gopal and Ram who paid him the total amount in the ratio 2 : 3. Gopal invested a further Rs. 2 lakh in the land and planted coconut and lemon trees in the ratio 5 : 1 on equal areas of land. There were a total of 100 lemon trees. The cost of one coconut was Rs. 5. The crop took 7 years to mature and when the crop was reaped in 1997, the total revenue generated was 25% of the total amount put in by Gopal and Ram together. The revenue generated from the coconut and lemon trees was in the ratio 3 : 2 and it was shared equally by Gopal and Ram as the initial amount spent by them were equal.
What was the amount received by Gopal in 1997?
Direction: Answer the questions based on the following information.
Krishna distributed 10-acre land to Gopal and Ram who paid him the total amount in the ratio 2 : 3. Gopal invested a further Rs. 2 lakh in the land and planted coconut and lemon trees in the ratio 5 : 1 on equal areas of land. There were a total of 100 lemon trees. The cost of one coconut was Rs. 5. The crop took 7 years to mature and when the crop was reaped in 1997, the total revenue generated was 25% of the total amount put in by Gopal and Ram together. The revenue generated from the coconut and lemon trees was in the ratio 3 : 2 and it was shared equally by Gopal and Ram as the initial amount spent by them were equal.
What was the value of output per tree for coconuts?
Direction: Answer the questions based on the following information.
Krishna distributed 10-acre land to Gopal and Ram who paid him the total amount in the ratio 2 : 3. Gopal invested a further Rs. 2 lakh in the land and planted coconut and lemon trees in the ratio 5 : 1 on equal areas of land. There were a total of 100 lemon trees. The cost of one coconut was Rs. 5. The crop took 7 years to mature and when the crop was reaped in 1997, the total revenue generated was 25% of the total amount put in by Gopal and Ram together. The revenue generated from the coconut and lemon trees was in the ratio 3 : 2 and it was shared equally by Gopal and Ram as the initial amount spent by them were equal.
What was the ratio of yields per acre of land for coconuts and lemons (in terms of number of lemons and coconuts)?
Direction: Answer the questions based on the following information.
Ghosh Babu has a manufacturing unit. The following graph gives the cost for various number of units. Given: Profit = Revenue – Variable cost – Fixed cost. The fixed cost remains constant up to 34 units after which additional investment is to be done in fixed assets. In any case, production cannot exceed 50 units.
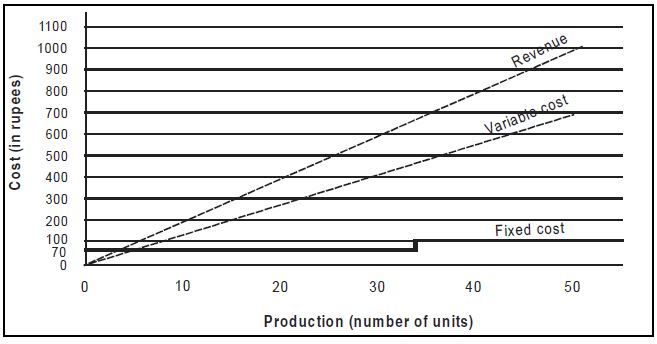
What is the minimum number of units that need to be produced to make sure that there was no loss?
Direction: Answer the questions based on the following information.
Ghosh Babu has a manufacturing unit. The following graph gives the cost for various number of units. Given: Profit = Revenue – Variable cost – Fixed cost. The fixed cost remains constant up to 34 units after which additional investment is to be done in fixed assets. In any case, production cannot exceed 50 units.
How many units should be manufactured such that the profit was at least Rs. 50?
Direction: Answer the questions based on the following information.
Ghosh Babu has a manufacturing unit. The following graph gives the cost for various number of units. Given: Profit = Revenue – Variable cost – Fixed cost. The fixed cost remains constant up to 34 units after which additional investment is to be done in fixed assets. In any case, production cannot exceed 50 units.
If at the most 40 units can be manufactured, then what is the number of units that can be manufactured to maximise profit per unit?
Direction: Answer the questions based on the following information.
Ghosh Babu has a manufacturing unit. The following graph gives the cost for various number of units. Given: Profit = Revenue – Variable cost – Fixed cost. The fixed cost remains constant up to 34 units after which additional investment is to be done in fixed assets. In any case, production cannot exceed 50 units.
If the production cannot exceed 45 units, then what is the number of units that can maximise profit per unit?
Direction: Answer the questions based on the following information.
Ghosh Babu has a manufacturing unit. The following graph gives the cost for various number of units. Given: Profit = Revenue – Variable cost – Fixed cost. The fixed cost remains constant up to 34 units after which additional investment is to be done in fixed assets. In any case, production cannot exceed 50 units.
If the fixed cost of production goes up by Rs. 40, then what is the minimum number of units that need to be manufactured to make sure that there is no loss?
Direction: Answer the questions based on the following information.
In the following chart, the price of logs shown is per cubic metre that of plywood and saw timber is per tonne.
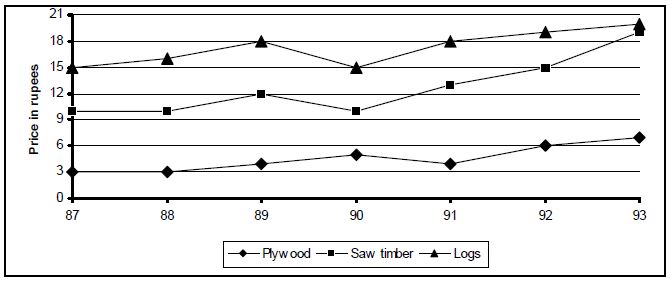
What is the maximum percentage increase in price per cubic metre or per tonne over the previous year?
Direction: Answer the questions based on the following information.
In the following chart, the price of logs shown is per cubic metre that of plywood and saw timber is per tonne.
Which product shows the maximum percentage increase in price over the period?
Direction: Answer the questions based on the following information.
In the following chart, the price of logs shown is per cubic metre that of plywood and saw timber is per tonne.
If 1 m3 = 750 kg for saw timber, find in which year was the difference in prices of saw timber and logs the least?
Direction: Answer the questions based on the following information.
In the following chart, the price of logs shown is per cubic metre that of plywood and saw timber is per tonne.
If one cubic metre = 700 kg for plywood and 800 kg for saw timber, find in which year was the difference in the prices of plywood and saw timber (per cubic metre) the maximum?
Direction: Answer the questions based on the following information.
In the following chart, the price of logs shown is per cubic metre that of plywood and saw timber is per tonne.
If the volume sales of plywood, saw timber and logs were 40%, 30% and 30% respectively, then what was the average realisation in 1993 per cubic metre of sales? (Weight of one cubic metre of saw dust and plywood both = 800 kg)
Direction: Answer the questions based on the following information.
In the following chart, the price of logs shown is per cubic metre that of plywood and saw timber is per tonne.
In the previous question, if in 1994, prices increased by 5%, 1% and 10% while the volume sales break-up was 40%, 30% and 30% for plywood, saw timber and logs respectively, then what was the average realisation?
Direction: Answer the question based on the following information.
The following operations are defined for real numbers.
a # b = a + b, if a and b both are positive else a # b = 1
a ∇ b = (a × b)a + b if a × b is positive else a ∇ b = 1.
Direction: Answer the question based on the following information.
The following operations are defined for real numbers.
a # b = a + b, if a and b both are positive else a # b = 1
a ∇ b = (a × b)a + b if a × b is positive else a ∇ b = 1.
Direction: Answer the question based on the following information.
The following operations are defined for real numbers.
a # b = a + b, if a and b both are positive else a # b = 1
a ∇ b = (a × b)a + b if a × b is positive else a ∇ b = 1.
then which of the following must be true?
Direction: Answer the question based on the following information.
The following operations are defined for real numbers.
a # b = a + b, if a and b both are positive else a # b = 1
a ∇ b = (a × b)a + b if a × b is positive else a ∇ b = 1.
P, Q, R and S are four statements. Relation between these statements is as follows.
I. If P is true, then Q must be true.
II. If Q is true, then R must be true.
III. If S is true, then either Q is false or R is false.
Which of the following must be true?
Direction: Answer the questions based on the following information.
A, B, C and D are to be seated in a row. But C and D cannot be together. Also B cannot be at the third place.
Which of the following must be false?
Direction: Answer the questions based on the following information.
A, B, C and D are to be seated in a row. But C and D cannot be together. Also B cannot be at the third place.
If A is not at the third place, then which of the following options does C have?
Direction: Answer the questions based on the following information.
A, B, C and D are to be seated in a row. But C and D cannot be together. Also B cannot be at the third place.
If A and B are together, then which of the following must be necessarily true?
Direction: Answer the questions based on the following information.
Amar, Akbar and Anthony are three friends. Only three colours are available for their shirts, viz. red, green and blue. Amar does not wear red shirt. Akbar does not wear green shirt. Anthony does not wear blue shirt.
If Akbar and Anthony wear the same colour of shirts, then which of the following is not true?
Direction: Answer the questions based on the following information.
Amar, Akbar and Anthony are three friends. Only three colours are available for their shirts, viz. red, green and blue. Amar does not wear red shirt. Akbar does not wear green shirt. Anthony does not wear blue shirt.
If two of them wear the same colour, then how many of the following must be false?
I. Amar wears blue and Akbar does not wear green
II. Amar does not wear blue and Akbar wears blue
III. Amar does not wear blue and Akbar does not wear blue
IV. Amar wears green, Akbar does not wear red, Anthony does not wear green
Direction: Answer the questions based on the following information.
Amar, Akbar and Anthony are three friends. Only three colours are available for their shirts, viz. red, green and blue. Amar does not wear red shirt. Akbar does not wear green shirt. Anthony does not wear blue shirt.
A, B, C, D, ..., X, Y, Z are the players who participated in a tournament. Everyone played with every other player exactly once. A win scores 2 points, a draw scores 1 point and a loss scores 0 point. None of the matches ended in a draw. No two players scored the same score. At the end of the tournament, by ranking list is published which is in accordance with the alphabetical order. Then