CAT 1996 — DILR
All 46 DILR questions from CAT 1996, with the answer key and detailed solutions. Practise free — check answers as you go, or tap Show solution.
CAT 1996 · DILR
Direction: Answer the questions based on the following information.
The data given in the table shows the investment details in country ‘Fortune Land’ of companies A, B, C, D, E and F. Figures in the table are in US dollars in billions.
âââââââ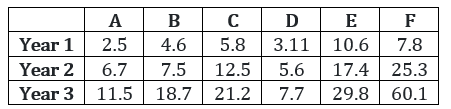 ââ
ââ
What is the percentage increase in investment of B, C, D and E from year 1 to year 3?
Direction: Answer the questions based on the following information.
The data given in the table shows the investment details in country ‘Fortune Land’ of companies A, B, C, D, E and F. Figures in the table are in US dollars in billions.
âââââââââ
What is the ratio of investments of E to F for the years 1 to 3?
Direction: Answer the questions based on the following information.
The data given in the table shows the investment details in country ‘Fortune Land’ of companies A, B, C, D, E and F. Figures in the table are in US dollars in billions.
âââââââââ
What is D’s contribution as a percentage of total investments in year 2?
Direction: Answer the questions based on the following information.
The data given in the table shows the investment details in country ‘Fortune Land’ of companies A, B, C, D, E and F. Figures in the table are in US dollars in billions.
âââââââââ
For which company is investment not increased from year 1 to year 3?
Direction: Answer the questions based on the following information.
The data given in the table shows the investment details in country ‘Fortune Land’ of companies A, B, C, D, E and F. Figures in the table are in US dollars in billions.
âââââââââ
What is the percentage difference in investments of companies A, B, C and companies D, E, F in year 2?
Direction: Answer the questions based on the following information.
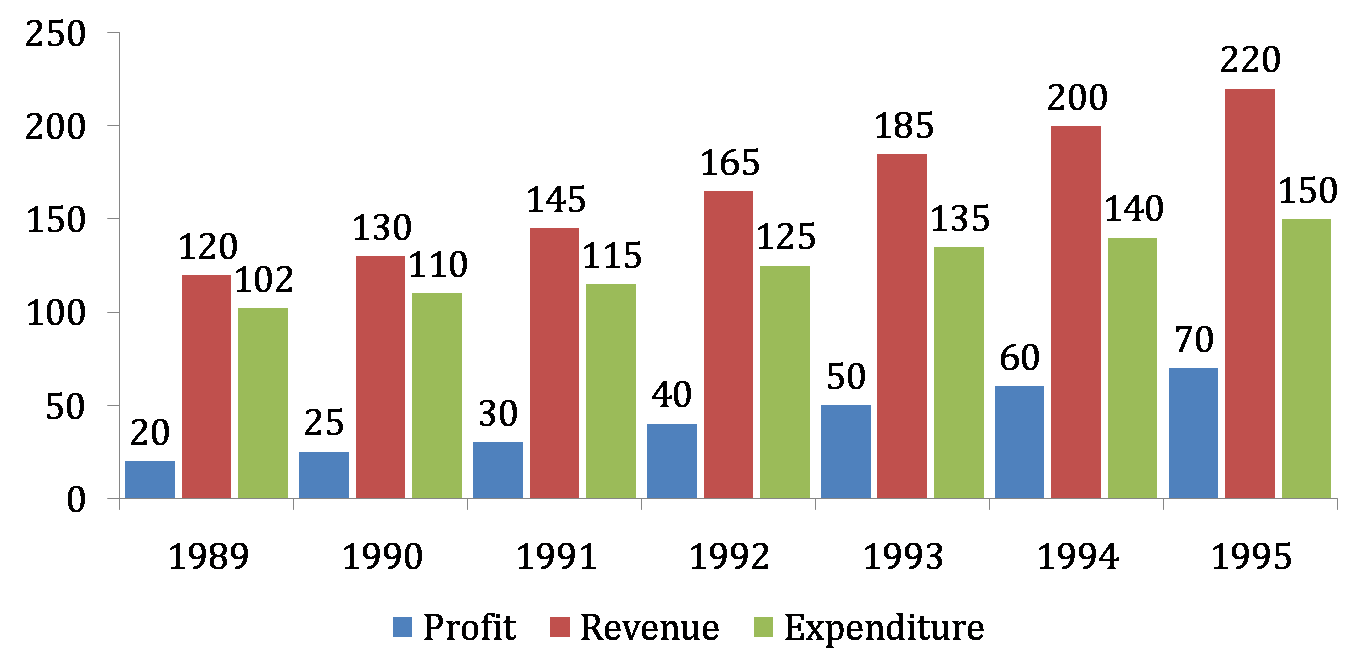
The average revenue collected in the given 7 years is approximately
Direction: Answer the questions based on the following information.
The expenditure for the 7 years together form what per cent of the revenues during the same period?
Direction: Answer the questions based on the following information.
Which year showed the greatest percentage increase in profit as compared to the previous year?
Direction: Answer the questions based on the following information.
In which year was the growth in expenditure maximum as compared to the previous year?
Direction: Answer the questions based on the following information.
If the profit in 1996 shows the annual rate of growth as it had shown in 1995 over the previous year, then what approximately will be the profit in 1996?
Direction: Answer the questions based on the following information, which gives data about certain coffee producers in India.
âââââââ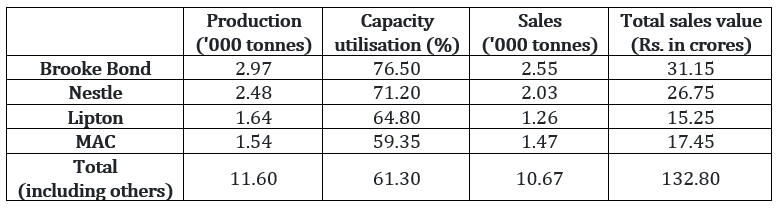 âââââââ
What is the maximum production capacity (in '000 tonnes) of Lipton for coffee?
Direction: Answer the questions based on the following information, which gives data about certain coffee producers in India.
ââââââââââââââ
Which company out of the four companies mentioned above has the maximum unutilised capacity (in '000 tonnes)?
Direction: Answer the questions based on the following information, which gives data about certain coffee producers in India.
ââââââââââââââ
What is the approximate total production capacity (in ‘000 tonnes) for coffee in India?
Direction: Answer the questions based on the following information, which gives data about certain coffee producers in India.
ââââââââââââââ
The highest price for coffee per kilogram is for
Direction: Answer the questions based on the following information, which gives data about certain coffee producers in India.
ââââââââââââââ
What percent of the total market share (by sales value) is controlled by ‘others’?
Direction: Answer the questions based on the following information.
Mulayam Software Co., before selling a package to its clients, follows the given schedule.
âââââââ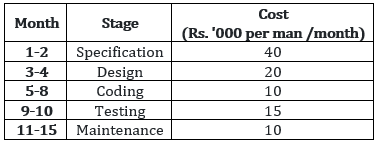
âââââââThe number of people employed in each month is:
âââââââ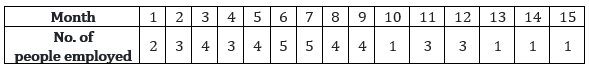 âââââââ
Due to overrun in ‘design’, the design stage took 3 months, i.e. months 3, 4 and 5. The number of people working on design in the fifth month was 5. Calculate the percentage change in the cost incurred in the fifth month. (Due to improvement in ‘coding’ technique, this stage was completed in months 6-8 only.)
Direction: Answer the questions based on the following information.
Mulayam Software Co., before selling a package to its clients, follows the given schedule.
âââââââ
âââââââThe number of people employed in each month is:
ââââââââââââââ
With reference to the above question, what is the cost incurred in the new ‘coding’ stage? (Under the new technique, 4 people work in the sixth month and 5 in the eighth.)
Direction: Answer the questions based on the following information.
Mulayam Software Co., before selling a package to its clients, follows the given schedule.
âââââââ
âââââââThe number of people employed in each month is:
ââââââââââââââ
What is the difference in cost between the old and the new techniques?
Direction: Answer the questions based on the following information.
Mulayam Software Co., before selling a package to its clients, follows the given schedule.
âââââââ
âââââââThe number of people employed in each month is:
ââââââââââââââ
Under the new technique, which stage of software development is most expensive for Mulayam Software Co.?
Direction: Answer the questions based on the following information.
Mulayam Software Co., before selling a package to its clients, follows the given schedule.
âââââââ
âââââââThe number of people employed in each month is:
ââââââââââââââ
Which five consecutive months have the lowest average cost per man-month under the new technique?
Direction: Answer the questions based on the following information.
The amount of money invested (rupees in crores) in the core infrastructure areas of two districts, Chittoor and Khammam of Andhra Pradesh, is as follows.
âââââââ âââââââ
By what per cent was the total investment in the two districts more in 1996 as compared to 1995?
Direction: Answer the questions based on the following information.
The amount of money invested (rupees in crores) in the core infrastructure areas of two districts, Chittoor and Khammam of Andhra Pradesh, is as follows.
ââââââââââââââ
The investment in electricity and thermal energy in 1995 in these two districts formed what per cent of the total investment made in that year?
Direction: Answer the questions based on the following information.
The amount of money invested (rupees in crores) in the core infrastructure areas of two districts, Chittoor and Khammam of Andhra Pradesh, is as follows.
ââââââââââââââ
In Khammam district, the investment in which area in 1996 showed the highest percentage increase over the investment in that area in 1995?
Direction: Answer the questions based on the following information.
The amount of money invested (rupees in crores) in the core infrastructure areas of two districts, Chittoor and Khammam of Andhra Pradesh, is as follows.
ââââââââââââââ
Approximately how many times was the total investment in Chittoor to the total investment in Khammam?
Direction: Answer the questions based on the following information.
The amount of money invested (rupees in crores) in the core infrastructure areas of two districts, Chittoor and Khammam of Andhra Pradesh, is as follows.
ââââââââââââââ
If the total investment in Khammam shows the same rate of increase in 1997, as it had shown from 1995 to 1996, what approximately would be the total investment in Khammam in 1997?
Direction: Answer the questions based on the following graph.

Employees in thousands Sales – Cost = Profit
Which month records the highest profit?
Direction: Answer the questions based on the following graph.
Employees in thousands Sales – Cost = Profit
In which month is the total increase in the cost highest as compared to two months ago?
Direction: Answer the questions based on the following graph.
Employees in thousands Sales – Cost = Profit
In which month is the percentage increase in sales two months before, the highest?
Direction: Answer the questions based on the following graph.
Employees in thousands Sales – Cost = Profit
Which month has the highest profit per employee?
Direction: Answer the questions based on the following graph.
Employees in thousands Sales – Cost = Profit
Assuming that no employees left the job, how many more people did the company take on in the given period?
Direction: Answer the questions based on the following information.
The first table gives the percentage of students in MBA class, who sought employment in the areas of finance, marketing and software. The second table gives the average starting salaries of the students per month, (rupees in thousands) in these areas. The third table gives the number of students who passed out in each year.
First table
âââââââ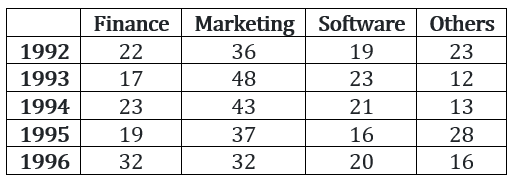
âââââââSecond table
âââââââ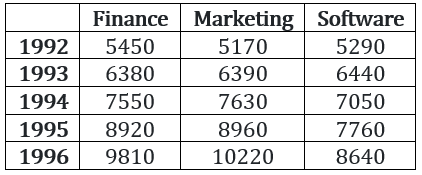
âââââââThird table

The number of students who get jobs in finance is less than the students getting marketing jobs, in the 5 years, by
Direction: Answer the questions based on the following information.
The first table gives the percentage of students in MBA class, who sought employment in the areas of finance, marketing and software. The second table gives the average starting salaries of the students per month, (rupees in thousands) in these areas. The third table gives the number of students who passed out in each year.
First table
âââââââ
âââââââSecond table
âââââââ
âââââââThird table
What is the percentage increase in the average salary of finance from 1992 to 1996?
Direction: Answer the questions based on the following information.
The first table gives the percentage of students in MBA class, who sought employment in the areas of finance, marketing and software. The second table gives the average starting salaries of the students per month, (rupees in thousands) in these areas. The third table gives the number of students who passed out in each year.
First table
âââââââ
âââââââSecond table
âââââââ
âââââââThird table
The average annual rate at which the initial salary offered in software increases is
Direction: Answer the questions based on the following information.
The first table gives the percentage of students in MBA class, who sought employment in the areas of finance, marketing and software. The second table gives the average starting salaries of the students per month, (rupees in thousands) in these areas. The third table gives the number of students who passed out in each year.
First table
âââââââ
âââââââSecond table
âââââââ
âââââââThird table
What is the average monthly salary offered to a management graduate in 1993?
Direction: Answer the questions based on the following information.
The first table gives the percentage of students in MBA class, who sought employment in the areas of finance, marketing and software. The second table gives the average starting salaries of the students per month, (rupees in thousands) in these areas. The third table gives the number of students who passed out in each year.
First table
âââââââ
âââââââSecond table
âââââââ
âââââââThird table
In 1994, students seeking jobs in finance earned ___ more than those opting for software (per annum).
Direction: Answer the questions based on the following information.
The first table gives the percentage of students in MBA class, who sought employment in the areas of finance, marketing and software. The second table gives the average starting salaries of the students per month, (rupees in thousands) in these areas. The third table gives the number of students who passed out in each year.
First table
âââââââ
âââââââSecond table
âââââââ
âââââââThird table
Direction: Given below are six statements followed by sets of three. You are to mark the option in which the statements are most logically related.
1. Some pins are made of tin
2. All tin is made of copper
3. All copper is used for pins
4. Some tin is copper
5. Some pins are used for tin
6. Some copper is used for tin
Direction: Answer the questions based on the following information.
The first table gives the percentage of students in MBA class, who sought employment in the areas of finance, marketing and software. The second table gives the average starting salaries of the students per month, (rupees in thousands) in these areas. The third table gives the number of students who passed out in each year.
First table
âââââââ
âââââââSecond table
âââââââ
âââââââThird table
Direction: Given below are six statements followed by sets of three. You are to mark the option in which the statements are most logically related.
1. An ostrich lays eggs
2. All birds lay eggs
3. Some birds can fly
4. An ostrich cannot fly
5. An ostrich is a bird
6. An ostrich cannot swim
Direction: Answer the questions based on the following information.
The first table gives the percentage of students in MBA class, who sought employment in the areas of finance, marketing and software. The second table gives the average starting salaries of the students per month, (rupees in thousands) in these areas. The third table gives the number of students who passed out in each year.
First table
âââââââ
âââââââSecond table
âââââââ
âââââââThird table
Direction: Given below are six statements followed by sets of three. You are to mark the option in which the statements are most logically related.
1. Some paper is wood
2. All wood is good
3. All that is good is wood
4. All wood is paper
5. All paper is good
6. Some paper is good
Direction: Answer the questions based on the following information.
The first table gives the percentage of students in MBA class, who sought employment in the areas of finance, marketing and software. The second table gives the average starting salaries of the students per month, (rupees in thousands) in these areas. The third table gives the number of students who passed out in each year.
First table
âââââââ
âââââââSecond table
âââââââ
âââââââThird table
Direction: Given below are six statements followed by sets of three. You are to mark the option in which the statements are most logically related.
1. All bricks are tricks
2. Some tricks are shrieks
3. Some that are shrieks are bricks
4. Some tricks are not bricks
5. All tricks are shrieks
6. No tricks are shrieks
Direction: Answer the questions based on the following information.
The first table gives the percentage of students in MBA class, who sought employment in the areas of finance, marketing and software. The second table gives the average starting salaries of the students per month, (rupees in thousands) in these areas. The third table gives the number of students who passed out in each year.
First table
âââââââ
âââââââSecond table
âââââââ
âââââââThird table
Direction: Given below are six statements followed by sets of three. You are to mark the option in which the statements are most logically related.
1. Some sand is band
2. All sandal is band
3. All band is sandal
4. No sand is sandal
5. No band is sand
6. Some band is sandal
Direction: Answer the questions based on the following information.
The first table gives the percentage of students in MBA class, who sought employment in the areas of finance, marketing and software. The second table gives the average starting salaries of the students per month, (rupees in thousands) in these areas. The third table gives the number of students who passed out in each year.
First table
âââââââ
âââââââSecond table
âââââââ
âââââââThird table
Direction: Given below are six statements followed by sets of three. You are to mark the option in which the statements are most logically related.
1. No wife is a life
2. All life is strife
3. Some wife is strife
4. All that is wife is life
5. All wife is strife
6. No wife is strife
Direction: Answer the questions based on the following information.
The first table gives the percentage of students in MBA class, who sought employment in the areas of finance, marketing and software. The second table gives the average starting salaries of the students per month, (rupees in thousands) in these areas. The third table gives the number of students who passed out in each year.
First table
âââââââ
âââââââSecond table
âââââââ
âââââââThird table
Direction: Given below are six statements followed by sets of three. You are to mark the option in which the statements are most logically related.
1. Some crows are flies
2. Some flies are mosquitoes
3. All mosquitoes are flies
4. Some owls are flies
5. All owls are mosquitoes
6. Some mosquitoes are not owls
Direction: Answer the questions based on the following information.
The first table gives the percentage of students in MBA class, who sought employment in the areas of finance, marketing and software. The second table gives the average starting salaries of the students per month, (rupees in thousands) in these areas. The third table gives the number of students who passed out in each year.
First table
âââââââ
âââââââSecond table
âââââââ
âââââââThird table
Direction: Given below are six statements followed by sets of three. You are to mark the option in which the statements are most logically related.
1. Six is five
2. Five is not four
3. Some five is ten
4. Some six is twelve
5. Some twelve is five
6. Some ten is four
Direction: Answer the questions based on the following information.
The first table gives the percentage of students in MBA class, who sought employment in the areas of finance, marketing and software. The second table gives the average starting salaries of the students per month, (rupees in thousands) in these areas. The third table gives the number of students who passed out in each year.
First table
âââââââ
âââââââSecond table
âââââââ
âââââââThird table
Direction: Given below are six statements followed by sets of three. You are to mark the option in which the statements are most logically related.
1. Poor girls want to marry rich boys
2. Rich girls want to marry rich boys
3. Poor girls want to marry rich girls
4. Rich boys want to marry rich girls
5. Poor girls want to marry rich girls
6. Rich boys want to marry poor girls
Direction: Answer the questions based on the following information.
The first table gives the percentage of students in MBA class, who sought employment in the areas of finance, marketing and software. The second table gives the average starting salaries of the students per month, (rupees in thousands) in these areas. The third table gives the number of students who passed out in each year.
First table
âââââââ
âââââââSecond table
âââââââ
âââââââThird table
A cube of side 12 cm is painted red on all the faces and then cut into smaller cubes, each of side 3 cm. What is the total number of smaller cubes having none of their faces painted?
Direction: Answer the questions based on the following information.
The first table gives the percentage of students in MBA class, who sought employment in the areas of finance, marketing and software. The second table gives the average starting salaries of the students per month, (rupees in thousands) in these areas. The third table gives the number of students who passed out in each year.
First table
âââââââ
âââââââSecond table
âââââââ
âââââââThird table
In a watch, the minute hand crosses the hour hand for the third time exactly after every 3 hr 18 min and 15 s of watch time. What is the time gained or lost by this watch in one day?