CAT 1995 — DILR
All 40 DILR questions from CAT 1995, with the answer key and detailed solutions. Practise free — check answers as you go, or tap Show solution.
CAT 1995 · DILR
Six statements are given followed by four sets of combinations of three. You have to choose that set in which the statements are logically related.
1. Some bubbies are not dubbles
2. Some dubbles are not bubbles
3. Noone who is rubbles is dubbles
4. All dubbles are rubbles
5. Some dubbles are bubbles
6. Some who are rubbles are not bubbles
Six statements are given followed by four sets of combinations of three. You have to choose that set in which the statements are logically related.
1. Some men are bad
2. All men are sad
3. All bad things are men
4. All bad things are sad
5. Some sad things are men
6. Some sad things are bad
Six statements are given followed by four sets of combinations of three. You have to choose that set in which the statements are logically related.
1. All Toms are bright
2. No bright Toms are Dicks
3. Some Toms are Dicks
4. Some Dicks are bright
5. No Tom is a Dick
6. No Dick is a Tom
Six statements are given followed by four sets of combinations of three. You have to choose that set in which the statements are logically related.
1. All witches are nasty
2. Some devils are nasty
3. All witches are devils
4. All devils are nasty
5. Some nasty are devils
6. No witch is nasty
Six statements are given followed by four sets of combinations of three. You have to choose that set in which the statements are logically related.
1. No tingo is a bingo
2. All jingoes are bingoes
3. No jingo is a tingo
4. Some jingoes are not tingoes
5. Some tingoes are jingoes
6. Some bingoes are not tingoes
Direction: Answer the questions based on the following information.
âââââââ âââââââ
âââââââGhosh Babu surveyed his companies and obtained the following data. Income tax is paid from profit before tax and the remaining amount is apportioned to dividend and retained earnings. The retained earnings were accumulated into reserves. The reserves at the beginning of 1991 were Rs.80 lakh.
In which year was the tax per rupee of ‘profit before tax’ lowest?
Direction: Answer the questions based on the following information.
ââââââââââââââ
âââââââGhosh Babu surveyed his companies and obtained the following data. Income tax is paid from profit before tax and the remaining amount is apportioned to dividend and retained earnings. The retained earnings were accumulated into reserves. The reserves at the beginning of 1991 were Rs.80 lakh.
In which year was the sales per rupee of share capital highest?
Direction: Answer the questions based on the following information.
ââââââââââââââ
âââââââGhosh Babu surveyed his companies and obtained the following data. Income tax is paid from profit before tax and the remaining amount is apportioned to dividend and retained earnings. The retained earnings were accumulated into reserves. The reserves at the beginning of 1991 were Rs.80 lakh.
In which year was the profit before tax per rupee of sales highest?
Direction: Answer the questions based on the following information.
ââââââââââââââ
âââââââGhosh Babu surveyed his companies and obtained the following data. Income tax is paid from profit before tax and the remaining amount is apportioned to dividend and retained earnings. The retained earnings were accumulated into reserves. The reserves at the beginning of 1991 were Rs.80 lakh.
In which year was the percentage addition to reserves over previous years reserves the highest?
Direction: Answer the questions based on the following information.
ââââââââââââââ
âââââââGhosh Babu surveyed his companies and obtained the following data. Income tax is paid from profit before tax and the remaining amount is apportioned to dividend and retained earnings. The retained earnings were accumulated into reserves. The reserves at the beginning of 1991 were Rs.80 lakh.
Amount of the reserves at the end of 1994 is
Direction: Answer the questions based on the following table.
âââââââ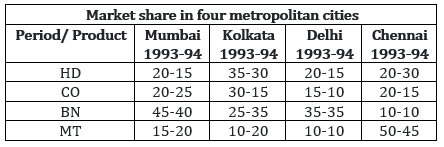 âââââââ
The maximum percentage decrease in market share is
Direction: Answer the questions based on the following table.
ââââââââââââââ
The city in which minimum number of products increased their market shares in 1993-94 is
Direction: Answer the questions based on the following table.
ââââââââââââââ
The market shares of which products did not decrease between 1993-94 in any city?
Direction: Answer the questions based on the following table.
ââââââââââââââ
The number of products which had 100% market share in four metropolitan cities is
Direction: Answer the questions based on the following table.
ââââââââââââââ
The number of products which doubled their market shares in one or more cities is
Direction: Answer the questions based on the following piecharts.


The operating profit in 1991-92 increased over that in 1990-91 by
Direction: Answer the questions based on the following piecharts.
The interest burden in 1991-92 was higher than that in 1990-91 by
Direction: Answer the questions based on the following piecharts.
If on an average, 20% rate of interest was charged on borrowed funds, then the total borrowed funds used by this company in the given two years amounted to
Direction: Answer the questions based on the following piecharts.
The retained profit in 1991-92, as compared to that in 1990-91 was
Direction: Answer the questions based on the following piecharts.
The equity base of these companies remained unchanged. Then the total dividend earning by the share holders in 1991-92 is
Direction: Answer the questions based on the following graph.

In which year was the trade deficit highest?
Direction: Answer the questions based on the following graph.
In how many years was the trade deficit less than the trade deficit in the succeeding year?
Direction: Answer the questions based on the following graph.
Export earning in 1990-91 is how many per cent of imports in 1991-92?
Direction: Answer the questions based on the following graph.
In the last three years, the total export earnings have accounted for how many per cent of the value of the imports?
Direction: Answer the questions based on the following graph.
Which of the following statements can be inferred from the graph?
I. In all the years shown in the graph, the trade deficit is less than the export earning.
II. Export earnings increased in every year between 1989-90 and 1991-92.
III. In all the years shown in the graph, the earning by exports is less than the expenditure on imports in the preceding year.
Direction: Answer the questions based on the following graph.
Revenue obtained by a publishing house while selling books, magazines and journals (Rs.in lakh).

Which year shows the highest change in revenue obtained from journals?
Direction: Answer the questions based on the following graph.
Revenue obtained by a publishing house while selling books, magazines and journals (Rs.in lakh).
In 1992, what per cent of the total revenue came from books?
Direction: Answer the questions based on the following graph.
Revenue obtained by a publishing house while selling books, magazines and journals (Rs.in lakh).
The number of years in which there was an increase in revenue from at least two categories is
Direction: Answer the questions based on the following graph.
Revenue obtained by a publishing house while selling books, magazines and journals (Rs.in lakh).
If 1993 were to show the same growth as 1992 over 1991, the revenue in 1993 must be
Direction: Answer the questions based on the following graph.
Revenue obtained by a publishing house while selling books, magazines and journals (Rs.in lakh).
The growth in total revenue from 1989 to 1992 is
Direction: Answer the questions based on the following table.
Machine M1 as well as machine M2 can independently produce either product P or product Q. The time taken by machines M1 and M2 (in minutes) to produce one unit of product P and product Q are given in the table below: (Each machine works 8 hour per day).
âââââââ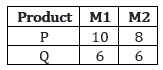 âââââââ
What is the maximum number of units that can be manufactured in one day?
Direction: Answer the questions based on the following table.
Machine M1 as well as machine M2 can independently produce either product P or product Q. The time taken by machines M1 and M2 (in minutes) to produce one unit of product P and product Q are given in the table below: (Each machine works 8 hour per day).
ââââââââââââââ
If M1 works at half its normal efficiency, what is the maximum number of units produced, if at least one unit of each must be produced?
Direction: Answer the questions based on the following table.
Machine M1 as well as machine M2 can independently produce either product P or product Q. The time taken by machines M1 and M2 (in minutes) to produce one unit of product P and product Q are given in the table below: (Each machine works 8 hour per day).
ââââââââââââââ
What is the least number of machine hours required to produce 30 pieces of P and 25 pieces of Q respectively?
Direction: Answer the questions based on the following table.
Machine M1 as well as machine M2 can independently produce either product P or product Q. The time taken by machines M1 and M2 (in minutes) to produce one unit of product P and product Q are given in the table below: (Each machine works 8 hour per day).
ââââââââââââââ
If the number of units of P is to be three times that of Q, what is the maximum idle time to maximize total units manufactured?
Direction: Answer the questions based on the following table.
Machine M1 as well as machine M2 can independently produce either product P or product Q. The time taken by machines M1 and M2 (in minutes) to produce one unit of product P and product Q are given in the table below: (Each machine works 8 hour per day).
ââââââââââââââ
If equal quantities of both are to be produced, then out of the four choices given below, the least efficient way would be
Direction: Answer the questions based on the following information.
A company produces five types of shirts — A, B, C, D and E — using cloth of three qualities — high, medium and low -, using dyes of three qualities — high, medium and low. One shirt requires 1.5 m of cloth. The following table gives respectively:
1. The number of shirts (of each category) produced, in thousands
2. The percentage distribution of cloth quality in each type of shirt, and
3. The percentage distribution of dye quality in each type of shirt.
âââââââ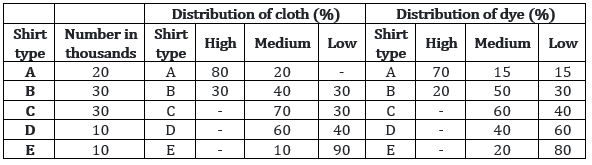 âââââââ
What is the total requirement of cloth?
Direction: Answer the questions based on the following information.
A company produces five types of shirts — A, B, C, D and E — using cloth of three qualities — high, medium and low -, using dyes of three qualities — high, medium and low. One shirt requires 1.5 m of cloth. The following table gives respectively:
1. The number of shirts (of each category) produced, in thousands
2. The percentage distribution of cloth quality in each type of shirt, and
3. The percentage distribution of dye quality in each type of shirt.
ââââââââââââââ
How many metres of low-quality cloth is consumed?
Direction: Answer the questions based on the following information.
A company produces five types of shirts — A, B, C, D and E — using cloth of three qualities — high, medium and low -, using dyes of three qualities — high, medium and low. One shirt requires 1.5 m of cloth. The following table gives respectively:
1. The number of shirts (of each category) produced, in thousands
2. The percentage distribution of cloth quality in each type of shirt, and
3. The percentage distribution of dye quality in each type of shirt.
ââââââââââââââ
How many metres of high quality cloth is consumed by A-type shirts?
Direction: Answer the questions based on the following information.
A company produces five types of shirts — A, B, C, D and E — using cloth of three qualities — high, medium and low -, using dyes of three qualities — high, medium and low. One shirt requires 1.5 m of cloth. The following table gives respectively:
1. The number of shirts (of each category) produced, in thousands
2. The percentage distribution of cloth quality in each type of shirt, and
3. The percentage distribution of dye quality in each type of shirt.
ââââââââââââââ
What is the ratio of the three qualities of dyes in high-quality cloth?
Direction: Answer the questions based on the following information.
A company produces five types of shirts — A, B, C, D and E — using cloth of three qualities — high, medium and low -, using dyes of three qualities — high, medium and low. One shirt requires 1.5 m of cloth. The following table gives respectively:
1. The number of shirts (of each category) produced, in thousands
2. The percentage distribution of cloth quality in each type of shirt, and
3. The percentage distribution of dye quality in each type of shirt.
ââââââââââââââ
What is the ratio of low-quality dye used for C-type shirts to that used for D- type shirts?