CAT 1997 — DILR
All 40 DILR questions from CAT 1997, with the answer key and detailed solutions. Practise free — check answers as you go, or tap Show solution.
CAT 1997 · DILR
Direction: Each of the following questions contains six statements followed by four sets of combinations of three. You have to choose that set in which the third statement logically follows from the first two.
A. No bird is viviparous.
B. All mammals are viviparous.
C. Bats are viviparous.
D. No bat is a bird.
E. No bird is a mammal.
F. All bats are mammals.
Direction: Each of the following questions contains six statements followed by four sets of combinations of three. You have to choose that set in which the third statement logically follows from the first two.
A. No mother is a nurse.
B. Some nurses like to work.
C. No woman is a prude.
D. Some prude are nurses.
E. Some nurses are women.
F. All women like to work.
Direction: Each of the following questions contains six statements followed by four sets of combinations of three. You have to choose that set in which the third statement logically follows from the first two.
A. Oranges are sweet.
B. All oranges are apples.
C. Some sweet are apples.
D. Some oranges are apples.
E. All sweet are sour.
F. Some apples are sour.
Direction: Each of the following questions contains six statements followed by four sets of combinations of three. You have to choose that set in which the third statement logically follows from the first two.
A. Zens are Marutis.
B. Zens are fragile.
C. Marutis are fragile.
D. Opels are fragile.
E. Marutis are Opels.
F. Opels are stable.
Direction: Each of the following questions contains six statements followed by four sets of combinations of three. You have to choose that set in which the third statement logically follows from the first two.
A. Dogs sleep in the open.
B. Sheep sleep indoors.
C. Dogs are like sheep.
D. All indoors are sheep.
E. Some dogs are not sheep.
F. Some open are not sheep.
Direction: In each of the following sentences, the main statement is followed by four sentences each. Select a pair of sentences that relate logically to the given statement.
Either Sam is ill, or he is drunk.
A. Sam is ill.
B. Sam is not ill.
C. Sam is drunk.
D. Sam is not drunk.
Direction: In each of the following sentences, the main statement is followed by four sentences each. Select a pair of sentences that relate logically to the given statement.
Whenever Ram hears of a tragedy, he loses sleep.
A. Ram heard of a tragedy.
B. Ram did not hear of a tragedy.
C. Ram lost sleep.
D. Ram did not lose sleep.
Direction: In each of the following sentences, the main statement is followed by four sentences each. Select a pair of sentences that relate logically to the given statement.
Either the train is late, or it has derailed.
A. The train is late.
B. The train is not late.
C. The train is derailed.
D. The train is not derailed.
Direction: In each of the following sentences, the main statement is followed by four sentences each. Select a pair of sentences that relate logically to the given statement.
When I read a horror story I have a nightmare.
A. I read a story.
B. I did not read a horror story.
C. I did not have a nightmare.
D. I had a nightmare.
Direction: In each of the following sentences, the main statement is followed by four sentences each. Select a pair of sentences that relate logically to the given statement.
When I eat berries I get rashes.
A. I ate berries.
B. I did not get rashes.
C. I did not eat berries.
D. I got rashes.
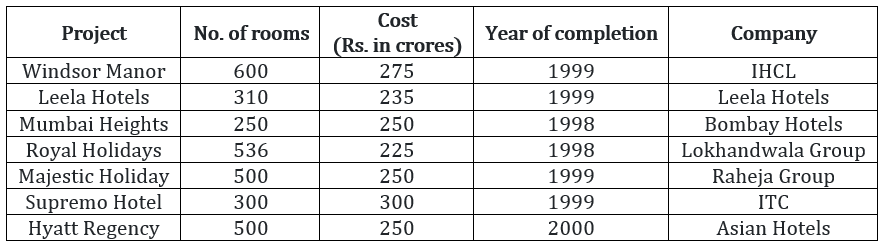
Direction: Answer the questions based on the following table.
 ââââââââââââââ
âââââââNote: All projects start in 1997.
Which of the following had the least cost per room?
Direction: Answer the questions based on the following table.
ââââââââââââââ
âââââââNote: All projects start in 1997.
Which of the following has the maximum number of rooms per crore of rupees?
Direction: Answer the questions based on the following table.
ââââââââââââââ
âââââââNote: All projects start in 1997.
Additional direction: Assume that the cost of the project is incurred in the year of completion; interest is charged at the rate of 10% per annum.
What is the cost incurred for projects completed in 1998?
Direction: Answer the questions based on the following table.
ââââââââââââââ
âââââââNote: All projects start in 1997.
Additional direction: Assume that the cost of the project is incurred in the year of completion; interest is charged at the rate of 10% per annum.
What is the cost incurred for projects completed in 1999?
Direction: Answer the questions based on the following table.
ââââââââââââââ
âââââââNote: All projects start in 1997.
Additional direction: Assume that the cost of the project is incurred in the year of completion; interest is charged at the rate of 10% per annum.
What is the approximate cost incurred for projects completed by 2000?
Direction: Answer the questions based on the following graph.
The graph given below shows the quantity of milk and food grains consumed annually along with female and male population (in millions). Use the data to answer the questions that follow.
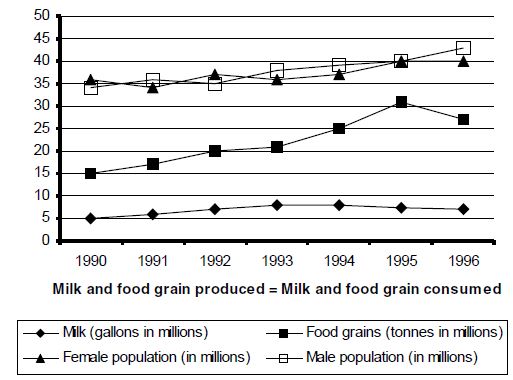
When was the per capita production of milk least?
Direction: Answer the questions based on the following graph.
The graph given below shows the quantity of milk and food grains consumed annually along with female and male population (in millions). Use the data to answer the questions that follow.
When was the per capita production of foodgrains most?
Direction: Answer the questions based on the following graph.
The graph given below shows the quantity of milk and food grains consumed annually along with female and male population (in millions). Use the data to answer the questions that follow.
In which year was the difference between the percentage increase in the production of foodgrains and milk maximum?
Direction: Answer the questions based on the following graph.
The graph given below shows the quantity of milk and food grains consumed annually along with female and male population (in millions). Use the data to answer the questions that follow.
If milk contains 320 calories and foodgrains contain 160 calories, in which year was the per capita consumption of calories highest?
Direction: Answer the questions based on the following graph.
The graph given below shows the quantity of milk and food grains consumed annually along with female and male population (in millions). Use the data to answer the questions that follow.
If one gallon milk contains 120 g of a particular nutrient and one tonne of foodgrains contains 80 g of the same nutrient, in which year was the availability of this nutrient maximum?
Direction: Answer the questions based on the following graph.
The graph given below shows the quantity of milk and food grains consumed annually along with female and male population (in millions). Use the data to answer the questions that follow.
Referring to the above question, in which year was the per capita consumption of this nutrient highest?
Direction: Answer the questions based on the following graph.
The graph given below gives the yearly details of money invested in producing a certain product over the years 1991 to 1995. It also gives the profit (in ‘000 rupees).
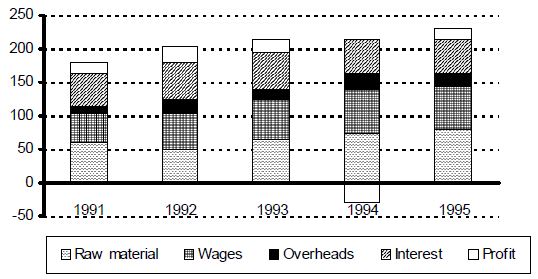
In which year was the increase in raw material maximum?
Direction: Answer the questions based on the following graph.
The graph given below gives the yearly details of money invested in producing a certain product over the years 1991 to 1995. It also gives the profit (in ‘000 rupees).
In which period was the change in profit maximum?
Direction: Answer the questions based on the following graph.
The graph given below gives the yearly details of money invested in producing a certain product over the years 1991 to 1995. It also gives the profit (in ‘000 rupees).
Which component of the cost production has remained more or less constant over the period?
Direction: Answer the questions based on the following graph.
The graph given below gives the yearly details of money invested in producing a certain product over the years 1991 to 1995. It also gives the profit (in ‘000 rupees).
In which year were the overheads, as a percentage of the raw material, maximum?
Direction: Answer the questions based on the following graph.
The graph given below gives the yearly details of money invested in producing a certain product over the years 1991 to 1995. It also gives the profit (in ‘000 rupees).
What percentage of the costs did the profits form over the period?
Direction: Answer the questions based on the following graph.
The graph given below gives the yearly details of money invested in producing a certain product over the years 1991 to 1995. It also gives the profit (in ‘000 rupees).
If the interest component is not included in the total cost calculation, which year would show the maximum profit per unit cost?
Direction: Answer the questions based on the following information.
The following table gives the tariff [in paise per kilo-watt-hour (kWh)] levied by the UPSEB in 1994-95, in four sectors and the regions within them. The table also gives the percentage change in the tariff as compared to 1991-92.
 ââââââââââââââ
If the amount of power consumed by the various regions in sector 1 is the same, then as compared to 1991-92 the net tariff in 1994-95
Direction: Answer the questions based on the following information.
The following table gives the tariff [in paise per kilo-watt-hour (kWh)] levied by the UPSEB in 1994-95, in four sectors and the regions within them. The table also gives the percentage change in the tariff as compared to 1991-92.
ââââââââââââââ
What was the approximate average tariff in region 3 in 1991-92?
Additional direction: The UPSEB supplies power under four categories: urban (25%), domestic (20%), industrial (40%) and rural (15%). In 1994-95, the total power produced by the UPSEB was, 7875 megawatts.
In 1994-95, if there was 10% decrease in the domestic consumption of power as compared to that in 1991-92, what was the consumption of power in the rural sector in 1991-92?
Additional direction: The UPSEB supplies power under four categories: urban (25%), domestic (20%), industrial (40%) and rural (15%). In 1994-95, the total power produced by the UPSEB was, 7875 megawatts.
In the given 2 years, what is the total tariff paid by the urban sector?
Additional direction: The UPSEB supplies power under four categories: urban (25%), domestic (20%), industrial (40%) and rural (15%). In 1994-95, the total power produced by the UPSEB was, 7875 megawatts.
Which of the following statements is true?
Direction: Answer the questions based on the following table.
The table given below gives the annual details of loans from rural banks and agricultural loans over the years 1970 to 1983. Using this data answer the questions that follow.
 ââââââââââââââ
In 1974, the amount of agricultural loans formed what percentage of the total loans?
Direction: Answer the questions based on the following table.
The table given below gives the annual details of loans from rural banks and agricultural loans over the years 1970 to 1983. Using this data answer the questions that follow.
ââââââââââââââ
From the given data, the number of rural loans up to 1980 formed approximately what percentage of those in 1983?
Direction: Answer the questions based on the following table.
The table given below gives the annual details of loans from rural banks and agricultural loans over the years 1970 to 1983. Using this data answer the questions that follow.
ââââââââââââââ
Which of the following pairs of years showed the maximum increase in the number of rural bank loans?
Direction: Answer the questions based on the following table.
The table given below gives the annual details of loans from rural banks and agricultural loans over the years 1970 to 1983. Using this data answer the questions that follow.
ââââââââââââââ
What is the value of the agricultural loans in 1983 at 1970 prices?
Direction: Answer the questions based on the following table.
The table given below gives the annual details of loans from rural banks and agricultural loans over the years 1970 to 1983. Using this data answer the questions that follow.
ââââââââââââââ
In which year was the number of rural bank loans per rural bank least?
Direction: Answer the questions based on the following table.
The table given below gives the annual details of loans from rural banks and agricultural loans over the years 1970 to 1983. Using this data answer the questions that follow.
ââââââââââââââ
What is the simple annual rate of increase in the number of agricultural loans from 1970 to 1983?
Additional direction: If the consumer price index for 1970 is to be taken as 105 and the indices for the subsequent years are to be corrected accordingly, then answer 184 and 185.
By roughly how many points do the indices for 1983 and 1975 differ?
Additional direction: If the consumer price index for 1970 is to be taken as 105 and the indices for the subsequent years are to be corrected accordingly, then answer 184 and 185.
What is the value of the loans in 1980 at 1983 prices?