Bar Graphs — XAT Previous-Year Questions
17 previous-year questions on Bar Graphs from XAT, with full solutions. Practise free — check answers as you go; sign in to save your progress.
Bar Graphs · XAT PYQs
Read the following scenario and answer the THREE questions that follow.
The enrolment of students (in 1000s) at each of the five universities named — MPU, JSU, LTU, PKU and TRU — during each of the eight years from 2014 to 2021 is represented in the following chart. The names of these universities are not shown in the chart, Stead they are labelled Unit 1, Unit 2, Unit 3, Unit 4 and Unit 5.
 âââââââ
However, these four pieces of information are available:
W: The magnitudes of TRU's and MPU's net change in enrolment between 2014 and 2021 are the closest among any two universities.
X: LTU had the same enrolment in consecutive years at least twice between 2014 and 2021.
Y: The increase in JSU's enrolment from 2015 to 2019 is about 50% of TRU's total enrolment in 2020.
Z: The enrolment in one of LTU and PKU had a steady decline between 2014 and 2021, while the enrolment in the other had no decline between any two consecutive years in the same period.
Which of the five universities can Univ 4 possibly be?
Read the following scenario and answer the THREE questions that follow.
The enrolment of students (in 1000s) at each of the five universities named — MPU, JSU, LTU, PKU and TRU — during each of the eight years from 2014 to 2021 is represented in the following chart. The names of these universities are not shown in the chart, Stead they are labelled Unit 1, Unit 2, Unit 3, Unit 4 and Unit 5.
âââââââ
However, these four pieces of information are available:
W: The magnitudes of TRU's and MPU's net change in enrolment between 2014 and 2021 are the closest among any two universities.
X: LTU had the same enrolment in consecutive years at least twice between 2014 and 2021.
Y: The increase in JSU's enrolment from 2015 to 2019 is about 50% of TRU's total enrolment in 2020.
Z: The enrolment in one of LTU and PKU had a steady decline between 2014 and 2021, while the enrolment in the other had no decline between any two consecutive years in the same period.
Which Univ’s enrolment was around twice that of LTU in 2014?
Read the following scenario and answer the THREE questions that follow.
The enrolment of students (in 1000s) at each of the five universities named — MPU, JSU, LTU, PKU and TRU — during each of the eight years from 2014 to 2021 is represented in the following chart. The names of these universities are not shown in the chart, Stead they are labelled Unit 1, Unit 2, Unit 3, Unit 4 and Unit 5.
âââââââ
However, these four pieces of information are available:
W: The magnitudes of TRU's and MPU's net change in enrolment between 2014 and 2021 are the closest among any two universities.
X: LTU had the same enrolment in consecutive years at least twice between 2014 and 2021.
Y: The increase in JSU's enrolment from 2015 to 2019 is about 50% of TRU's total enrolment in 2020.
Z: The enrolment in one of LTU and PKU had a steady decline between 2014 and 2021, while the enrolment in the other had no decline between any two consecutive years in the same period.
Which amongst the pieces of information mentioned below, if removed, will not prevent us from uniquely identifying the five universities?
Read the following scenario and answer the THREE questions that follow.
 âââââââ
The given candlestick chart depicts the prices of a particular stock over 10 consecutive days. A candlestick comprises of a rectangular box pieced by a line. The top and bottom ends of the line respectively indicate the maximum and minimum prices of the stock on that day, while the horizontal edges of the rectangle correspond to the stock's opening and closing prices. If the rectangle is white, the opening price is lower than the closing price, but if the rectangle is black, then it is the other way around.
Using the above information, answer the questions that follow:
Which day saw the maximum percentage increase in the stock price at closing from the opening?
Read the following scenario and answer the THREE questions that follow.
âââââââ
The given candlestick chart depicts the prices of a particular stock over 10 consecutive days. A candlestick comprises of a rectangular box pieced by a line. The top and bottom ends of the line respectively indicate the maximum and minimum prices of the stock on that day, while the horizontal edges of the rectangle correspond to the stock's opening and closing prices. If the rectangle is white, the opening price is lower than the closing price, but if the rectangle is black, then it is the other way around.
Using the above information, answer the questions that follow:
What is the highest magnitude of change over two consecutive days (for example,Day 1 → Day 3 or Day 5 → Day 7), in the maximum price touched by the stock duringthe 10-day period (choose the closest amongst the options given)?
Read the following scenario and answer the THREE questions that follow.
âââââââ
The given candlestick chart depicts the prices of a particular stock over 10 consecutive days. A candlestick comprises of a rectangular box pieced by a line. The top and bottom ends of the line respectively indicate the maximum and minimum prices of the stock on that day, while the horizontal edges of the rectangle correspond to the stock's opening and closing prices. If the rectangle is white, the opening price is lower than the closing price, but if the rectangle is black, then it is the other way around.
Using the above information, answer the questions that follow:
On which day is the ratio of the maximum price to the opening price, the highest across the ten days?
Answer the next 4 questions based on the following information:
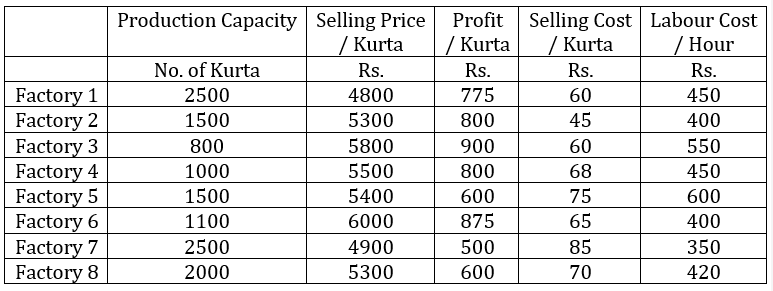
Abdul has 8 factories, with different capacities, producing boutique kurtas. In the production process, he incurs raw material cost, selling cost (for packaging and transportation) and labour cost. These costs per kurta vary across factories. In all these factories, a worker takes 2 hours to produce a kurta. Profit per kurta is calculated by deducting raw material cost, selling cost and labour cost from the selling price (Profit = selling price - raw materials cost - selling cost - labour cost). Any other cost can be ignored.
Exhibit: Business Details of Abdul’s 8 Factories
 âââââââ
Which of the following options is in decreasing order of raw materials cost?
Answer the next 4 questions based on the following information:
Abdul has 8 factories, with different capacities, producing boutique kurtas. In the production process, he incurs raw material cost, selling cost (for packaging and transportation) and labour cost. These costs per kurta vary across factories. In all these factories, a worker takes 2 hours to produce a kurta. Profit per kurta is calculated by deducting raw material cost, selling cost and labour cost from the selling price (Profit = selling price - raw materials cost - selling cost - labour cost). Any other cost can be ignored.
Exhibit: Business Details of Abdul’s 8 Factories
âââââââ
Which of the factories listed in the options below has the lowest sales margin (sales margin = profit per kurta divided by selling price per kurta)?
Answer the next 4 questions based on the following information:
Abdul has 8 factories, with different capacities, producing boutique kurtas. In the production process, he incurs raw material cost, selling cost (for packaging and transportation) and labour cost. These costs per kurta vary across factories. In all these factories, a worker takes 2 hours to produce a kurta. Profit per kurta is calculated by deducting raw material cost, selling cost and labour cost from the selling price (Profit = selling price - raw materials cost - selling cost - labour cost). Any other cost can be ignored.
Exhibit: Business Details of Abdul’s 8 Factories
âââââââ
Abdul has received an order for 2,000 kurtas from a big retail chain. They will collect the finished pre-packaged kurtas directly from the factories, saving him the selling cost. To deliver this order, he can use multiple factories for production. Which of the following options will ensure maximum profit from this order?
Answer the next 4 questions based on the following information:
Abdul has 8 factories, with different capacities, producing boutique kurtas. In the production process, he incurs raw material cost, selling cost (for packaging and transportation) and labour cost. These costs per kurta vary across factories. In all these factories, a worker takes 2 hours to produce a kurta. Profit per kurta is calculated by deducting raw material cost, selling cost and labour cost from the selling price (Profit = selling price - raw materials cost - selling cost - labour cost). Any other cost can be ignored.
Exhibit: Business Details of Abdul’s 8 Factories
âââââââ
Abdul has introduced a new technology in all his factories. As a result, a worker needs just 1.5 hours to produce a kurta. If raw materials cost and selling cost remain the same, which of the factories listed in the options below will yield the highest profit per kurta?
Answer the next 4 questions based on the information given below.
This graph depicts the last eight years annual salaries (in Rs. lacs.) offered to student during campus placement. Every year 100 students go through placement process. However, at least one of them fails to get placed. The salaries of all unplaced students are marked zero and represented in the graph.
 âââââââ
The bold line in the graph presents Mean salaries at various years.
In which year were a maximum number of students offered salaries between Rs. 20 to Rs. 30 lacs (both inclusive)?
Answer the next 4 questions based on the information given below.
This graph depicts the last eight years annual salaries (in Rs. lacs.) offered to student during campus placement. Every year 100 students go through placement process. However, at least one of them fails to get placed. The salaries of all unplaced students are marked zero and represented in the graph.
âââââââ
The bold line in the graph presents Mean salaries at various years.
Identify the years in which the annual median salary is higher by at least 60% than the average salary of the preceding year?
Answer the next 4 questions based on the information given below.
This graph depicts the last eight years annual salaries (in Rs. lacs.) offered to student during campus placement. Every year 100 students go through placement process. However, at least one of them fails to get placed. The salaries of all unplaced students are marked zero and represented in the graph.
âââââââ
The bold line in the graph presents Mean salaries at various years.
Identify the number of years in which the difference between the average salaries of the top 25% and the bottom 25% is more than Rs. 20 lacs:
Answer the next 4 questions based on the information given below.
This graph depicts the last eight years annual salaries (in Rs. lacs.) offered to student during campus placement. Every year 100 students go through placement process. However, at least one of them fails to get placed. The salaries of all unplaced students are marked zero and represented in the graph.
âââââââ
The bold line in the graph presents Mean salaries at various years.
If the average salary is computed excluding students with no offers, in how many years will the new average salary be greater than the existing median salary? Refer the table below for number of students without offers.
 âââââââ
Answer the following question based on the information given below.
The following graphs shows the revenue (in $ million) of three companies in their initial six years of operations, in an economy which is characterized by a persistent inflation.
 âââââââ
In 2010, which could be a valid statement about the revenues (adjusted for inflation) of these three companies?
Answer the following question based on the information given below.
The following graphs shows the revenue (in $ million) of three companies in their initial six years of operations, in an economy which is characterized by a persistent inflation.
âââââââ
The difference in the average percentage increase in revenues, from 4th to 6th year, of Yahoo and Facebook is:
Answer the following question based on the information given below.
The following graphs shows the revenue (in $ million) of three companies in their initial six years of operations, in an economy which is characterized by a persistent inflation.
âââââââ
What would have been Facebook’s revenue (in $ million) in its sixth year of operation if the company had matched Google’s percentage growth in revenues from the fifth to the sixth year?
Choose the option that is nearest to the answer.