Pie-Charts — XAT Previous-Year Questions
5 previous-year questions on Pie-Charts from XAT, with full solutions. Practise free — check answers as you go; sign in to save your progress.
Pie-Charts · XAT PYQs
Answer the next 3 questions based on the information given below.
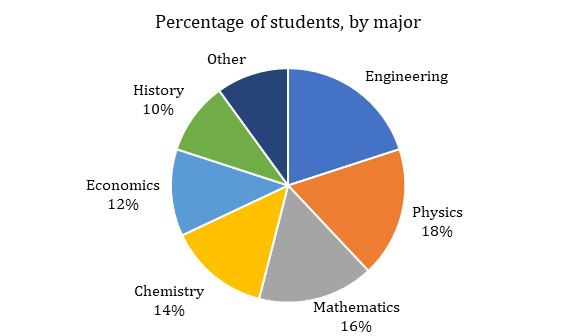
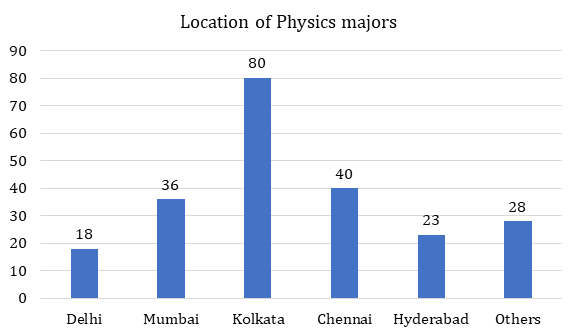
The break-up of the students in a university by subject major is given in the polar pie-chart. The bar chart shows the number of students who major in physics by geographic location.
 âââââââ
 âââââââ
How many students major in chemistry?
Answer the next 3 questions based on the information given below.
The break-up of the students in a university by subject major is given in the polar pie-chart. The bar chart shows the number of students who major in physics by geographic location.
âââââââ
âââââââ
12% of all students are from Chennai. What is the largest possible percentage of economics students that can be from Chennai, rounded oï¬ to the nearest integer?
Answer the next 3 questions based on the information given below.
The break-up of the students in a university by subject major is given in the polar pie-chart. The bar chart shows the number of students who major in physics by geographic location.
âââââââ
âââââââ
If the proportion of physics majors who are from Delhi is the same as the proportion of engineering majors who are from Delhi, how many engineering majors are from Delhi?
Answer the following question based on the information given below.
The following pie chart shows the percentage distribution of runs scored by a batsman in a test innings.
 âââââââ
If the batsman has scored a total of 306 runs, how many 4s and 6s did he hit?
Answer the following question based on the information given below.
The following pie chart shows the percentage distribution of runs scored by a batsman in a test innings.
âââââââ
If 5 of the dot balls had been hit for 4s, and if two of the shots for which the batsman scored 3 runs each had fetched him one run instead, what would have been the central angle of the sector corresponding to the percentage of runs scored in 4s?