Mixed Practice — CAT Previous-Year Questions
4 previous-year questions on Mixed Practice from CAT, with full solutions. Practise free — check answers as you go; sign in to save your progress.
Mixed Practice · CAT PYQs
Answer the following question based on the information given below.
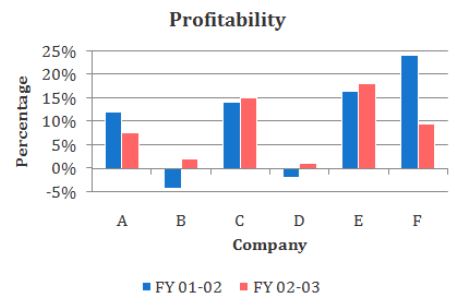
The profitability of a company is defined as the ratio of its operating profit to its operating income, typically expressed in percentage. The following two charts show the operating income as well as the profitability of six companies in the Financial Years (F.Y.s) 2001-02 and 2002-03.
The operating profits of four of these companies are plotted against their respective operating income figures for the F.Y. 2002-03, in the third chart given below.

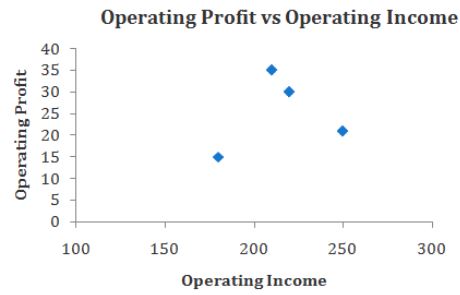
What is the approximate average operating profit, in F.Y. 2001-2002, of the two companies excluded from the third chart?
Answer the following question based on the information given below.
The profitability of a company is defined as the ratio of its operating profit to its operating income, typically expressed in percentage. The following two charts show the operating income as well as the profitability of six companies in the Financial Years (F.Y.s) 2001-02 and 2002-03.
The operating profits of four of these companies are plotted against their respective operating income figures for the F.Y. 2002-03, in the third chart given below.
Which company recorded the highest operating profit in F.Y. 2002-03?
Answer the following question based on the information given below.
The profitability of a company is defined as the ratio of its operating profit to its operating income, typically expressed in percentage. The following two charts show the operating income as well as the profitability of six companies in the Financial Years (F.Y.s) 2001-02 and 2002-03.
The operating profits of four of these companies are plotted against their respective operating income figures for the F.Y. 2002-03, in the third chart given below.
Which of the following statements is NOT true?
Answer the following question based on the information given below.
The profitability of a company is defined as the ratio of its operating profit to its operating income, typically expressed in percentage. The following two charts show the operating income as well as the profitability of six companies in the Financial Years (F.Y.s) 2001-02 and 2002-03.
The operating profits of four of these companies are plotted against their respective operating income figures for the F.Y. 2002-03, in the third chart given below.
The average operating profit in F.Y. 2002-03, of companies with profitability exceeding 10% in F.Y. 2002-03, is approximately