Bubble Charts — CAT Previous-Year Questions
25 previous-year questions on Bubble Charts from CAT, with full solutions. Practise free — check answers as you go; sign in to save your progress.
Bubble Charts · CAT PYQs
Answer the following questions based on the information given below.
The two plots below give the following information about six firms A, B, C, D, E, and F for 2019 and 2023.
PAT: The firm’s profits after taxes in Rs. crores,
ES: The firm’s employee strength, that is the number of employees in the firm, and
PRD: The percentage of the firm’s PAT that they spend on Research and Development (R&D).
In the plots, the horizontal and vertical coordinates of the point representing each firm give their ES and PAT values respectively. The PRD values of each firm are proportional to the areas around the points representing each firm. The areas are comparable between the two plots, i.e., equal areas in the two plots represent the same PRD values for the two years.


Approximate 2019 readings (ES on the horizontal axis, PAT on the vertical axis; bubble size ∝ PRD):
| Firm (2019) | ES (approx.) | PAT (approx.) | Bubble size (PRD) |
|---|---|---|---|
| A | 800 | 3000 | medium |
| B | 1000 | 2800 | medium-large |
| C | 600 | 2400 | medium |
| D | 600 | 3900 | small |
| E | 1200 | 2500 | large |
| F | 800 | 2500 | small |
Assume that the annual rate of growth in PAT over the previous year (ARG) remained constant over the years for each of the six firms. Which among the firms A, B, C, and E had the highest ARG?
Answer the following questions based on the information given below.
The two plots below give the following information about six firms A, B, C, D, E, and F for 2019 and 2023.
PAT: The firm’s profits after taxes in Rs. crores,
ES: The firm’s employee strength, that is the number of employees in the firm, and
PRD: The percentage of the firm’s PAT that they spend on Research and Development (R&D).
In the plots, the horizontal and vertical coordinates of the point representing each firm give their ES and PAT values respectively. The PRD values of each firm are proportional to the areas around the points representing each firm. The areas are comparable between the two plots, i.e., equal areas in the two plots represent the same PRD values for the two years.
Approximate 2019 readings (ES on the horizontal axis, PAT on the vertical axis; bubble size ∝ PRD):
| Firm (2019) | ES (approx.) | PAT (approx.) | Bubble size (PRD) |
|---|---|---|---|
| A | 800 | 3000 | medium |
| B | 1000 | 2800 | medium-large |
| C | 600 | 2400 | medium |
| D | 600 | 3900 | small |
| E | 1200 | 2500 | large |
| F | 800 | 2500 | small |
The ratio of the amount of money spent by Firm C on R&D in 2019 to that in 2023 is closest to
Answer the following questions based on the information given below.
The two plots below give the following information about six firms A, B, C, D, E, and F for 2019 and 2023.
PAT: The firm’s profits after taxes in Rs. crores,
ES: The firm’s employee strength, that is the number of employees in the firm, and
PRD: The percentage of the firm’s PAT that they spend on Research and Development (R&D).
In the plots, the horizontal and vertical coordinates of the point representing each firm give their ES and PAT values respectively. The PRD values of each firm are proportional to the areas around the points representing each firm. The areas are comparable between the two plots, i.e., equal areas in the two plots represent the same PRD values for the two years.
Approximate 2019 readings (ES on the horizontal axis, PAT on the vertical axis; bubble size ∝ PRD):
| Firm (2019) | ES (approx.) | PAT (approx.) | Bubble size (PRD) |
|---|---|---|---|
| A | 800 | 3000 | medium |
| B | 1000 | 2800 | medium-large |
| C | 600 | 2400 | medium |
| D | 600 | 3900 | small |
| E | 1200 | 2500 | large |
| F | 800 | 2500 | small |
Which among the firms A, C, E, and F had the maximum PAT per employee in 2023?
Answer the following questions based on the information given below.
The two plots below give the following information about six firms A, B, C, D, E, and F for 2019 and 2023.
PAT: The firm’s profits after taxes in Rs. crores,
ES: The firm’s employee strength, that is the number of employees in the firm, and
PRD: The percentage of the firm’s PAT that they spend on Research and Development (R&D).
In the plots, the horizontal and vertical coordinates of the point representing each firm give their ES and PAT values respectively. The PRD values of each firm are proportional to the areas around the points representing each firm. The areas are comparable between the two plots, i.e., equal areas in the two plots represent the same PRD values for the two years.
Approximate 2019 readings (ES on the horizontal axis, PAT on the vertical axis; bubble size ∝ PRD):
| Firm (2019) | ES (approx.) | PAT (approx.) | Bubble size (PRD) |
|---|---|---|---|
| A | 800 | 3000 | medium |
| B | 1000 | 2800 | medium-large |
| C | 600 | 2400 | medium |
| D | 600 | 3900 | small |
| E | 1200 | 2500 | large |
| F | 800 | 2500 | small |
Which among the firms C, D, E, and F had the least amount of R&D spending per employee in 2023?
Answer the following questions based on the information given below.
To compare the rainfall data, India Meteorological Department (IMD) calculated the Long Period Average (LPA) of rainfall during period June-August for each of the 16 states. The figure given below shows the actual rainfall (measured in mm) during June-August, 2019 and the percentage deviations from LPA of respective states in 2018. Each state along with its actual rainfall is presented in the figure.
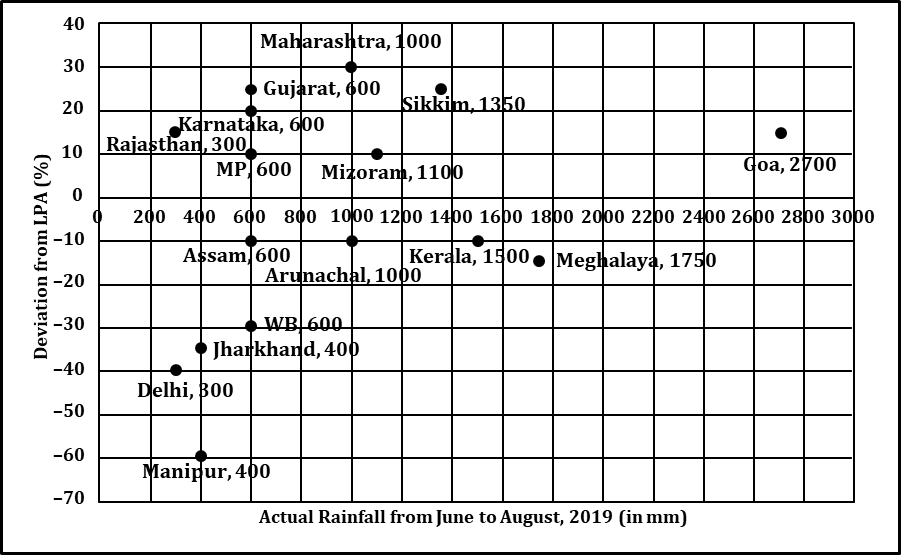
If a ‘Heavy Monsoon State’ is defined as a state with actual rainfall from June-August, 2019 of 900 mm or more, then approximately what percentage of ‘Heavy Monsoon States’ have a negative deviation from respective LPAs in 2019?
Answer the following questions based on the information given below.
To compare the rainfall data, India Meteorological Department (IMD) calculated the Long Period Average (LPA) of rainfall during period June-August for each of the 16 states. The figure given below shows the actual rainfall (measured in mm) during June-August, 2019 and the percentage deviations from LPA of respective states in 2018. Each state along with its actual rainfall is presented in the figure.
If a ‘Low Monsoon State’ is defined as a state with actual rainfall from June-August, 2019 of 750 mm or less, then what is the median ‘deviation from LPA’ (as defined in the Y-axis of the figure) of ‘Low Monsoon States’?
Answer the following questions based on the information given below.
To compare the rainfall data, India Meteorological Department (IMD) calculated the Long Period Average (LPA) of rainfall during period June-August for each of the 16 states. The figure given below shows the actual rainfall (measured in mm) during June-August, 2019 and the percentage deviations from LPA of respective states in 2018. Each state along with its actual rainfall is presented in the figure.
What is the average rainfall of all states that have actual rainfall of 600 mm or less in 2019 and have a negative deviation from LPA?
Answer the following questions based on the information given below.
To compare the rainfall data, India Meteorological Department (IMD) calculated the Long Period Average (LPA) of rainfall during period June-August for each of the 16 states. The figure given below shows the actual rainfall (measured in mm) during June-August, 2019 and the percentage deviations from LPA of respective states in 2018. Each state along with its actual rainfall is presented in the figure.
The LPA of a state for a year is defined as the average rainfall in the preceding 10 years considering the period of June-August. For example, LPA in 2018 is the average rainfall during 2009-2018 and LPA in 2019 is the average rainfall during 2010-2019. It is also observed that the actual rainfall in Gujarat in 2019 is 20% more than the rainfall in 2009. The LPA of Gujarat in 2019 is closest to
Answer the following question based on the information given below.
Each of the 23 boxes in the picture below represents a product manufactured by one of the following three companies: Alfa, Bravo and Charlie. The area of a box is proportional to the revenue from the corresponding product, while its centre represents the Product popularity and Market potential scores of the product (out of 20). The shadings of some of the boxes have got erased.

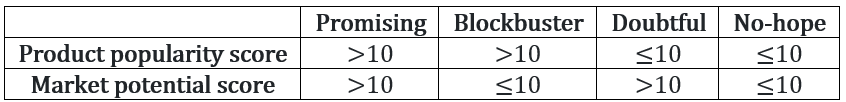
The companies classified their products into four categories based on a combination of scores (out of 20) on the two parameters – Product popularity and Market potential as given below:
 âââââââ
The following facts are known:
- Alfa and Bravo had the same number of products in the Blockbuster category.
- Charlie had more products than Bravo but fewer products than Alfa in the No-hope category.
- Each company had an equal number of products in the Promising category.
- Charlie did not have any product in the Doubtful category, while Alfa had one product more than Bravo in this category.
- Bravo had a higher revenue than Alfa from products in the Doubtful category.
- Charlie had a higher revenue than Bravo from products in the Blockbuster category.
- Bravo and Charlie had the same revenue from products in the No-hope category.
- Alfa and Charlie had the same total revenue considering all products.
Considering all companies' products, which product category had the highest revenue?
Answer the following question based on the information given below.
Each of the 23 boxes in the picture below represents a product manufactured by one of the following three companies: Alfa, Bravo and Charlie. The area of a box is proportional to the revenue from the corresponding product, while its centre represents the Product popularity and Market potential scores of the product (out of 20). The shadings of some of the boxes have got erased.
The companies classified their products into four categories based on a combination of scores (out of 20) on the two parameters – Product popularity and Market potential as given below:
âââââââ
The following facts are known:
- Alfa and Bravo had the same number of products in the Blockbuster category.
- Charlie had more products than Bravo but fewer products than Alfa in the No-hope category.
- Each company had an equal number of products in the Promising category.
- Charlie did not have any product in the Doubtful category, while Alfa had one product more than Bravo in this category.
- Bravo had a higher revenue than Alfa from products in the Doubtful category.
- Charlie had a higher revenue than Bravo from products in the Blockbuster category.
- Bravo and Charlie had the same revenue from products in the No-hope category.
- Alfa and Charlie had the same total revenue considering all products.
Which of the following is the correct sequence of numbers of products Bravo had in No-hope, Doubtful, Promising and Blockbuster categories respectively?
Answer the following question based on the information given below.
Each of the 23 boxes in the picture below represents a product manufactured by one of the following three companies: Alfa, Bravo and Charlie. The area of a box is proportional to the revenue from the corresponding product, while its centre represents the Product popularity and Market potential scores of the product (out of 20). The shadings of some of the boxes have got erased.
The companies classified their products into four categories based on a combination of scores (out of 20) on the two parameters – Product popularity and Market potential as given below:
âââââââ
The following facts are known:
- Alfa and Bravo had the same number of products in the Blockbuster category.
- Charlie had more products than Bravo but fewer products than Alfa in the No-hope category.
- Each company had an equal number of products in the Promising category.
- Charlie did not have any product in the Doubtful category, while Alfa had one product more than Bravo in this category.
- Bravo had a higher revenue than Alfa from products in the Doubtful category.
- Charlie had a higher revenue than Bravo from products in the Blockbuster category.
- Bravo and Charlie had the same revenue from products in the No-hope category.
- Alfa and Charlie had the same total revenue considering all products.
Which of the following statements is NOT correct?
Answer the following question based on the information given below.
Each of the 23 boxes in the picture below represents a product manufactured by one of the following three companies: Alfa, Bravo and Charlie. The area of a box is proportional to the revenue from the corresponding product, while its centre represents the Product popularity and Market potential scores of the product (out of 20). The shadings of some of the boxes have got erased.
The companies classified their products into four categories based on a combination of scores (out of 20) on the two parameters – Product popularity and Market potential as given below:
âââââââ
The following facts are known:
- Alfa and Bravo had the same number of products in the Blockbuster category.
- Charlie had more products than Bravo but fewer products than Alfa in the No-hope category.
- Each company had an equal number of products in the Promising category.
- Charlie did not have any product in the Doubtful category, while Alfa had one product more than Bravo in this category.
- Bravo had a higher revenue than Alfa from products in the Doubtful category.
- Charlie had a higher revenue than Bravo from products in the Blockbuster category.
- Bravo and Charlie had the same revenue from products in the No-hope category.
- Alfa and Charlie had the same total revenue considering all products.
If the smallest box on the grid is equivalent to revenue of Rs.1 crore, then what approximately was the total revenue of Bravo in Rs. crore?
Answer the following question based on the information given below.
Telecom operators get revenue from transfer of data and voice. Average revenue received from transfer of each unit of data is known as ARDT. In the diagram below, the revenue received from data transfer as percentage of total revenue received and the ARDT in US Dollars (USD) are given for various countries.

If the total revenue received is the same for the pairs of countries listed in the choices below, choose the pair that has approximately the same volume of data transfer.
Answer the following question based on the information given below.
Telecom operators get revenue from transfer of data and voice. Average revenue received from transfer of each unit of data is known as ARDT. In the diagram below, the revenue received from data transfer as percentage of total revenue received and the ARDT in US Dollars (USD) are given for various countries.
It was found that the volume of data transfer in India is the same as that of Singapore. Then which of the following statements are true?
Answer the following question based on the information given below.
Telecom operators get revenue from transfer of data and voice. Average revenue received from transfer of each unit of data is known as ARDT. In the diagram below, the revenue received from data transfer as percentage of total revenue received and the ARDT in US Dollars (USD) are given for various countries.
It is expected that by 2010, revenue from the data transfer as a percentage of total revenue will triple for India and double for Sweden. Assume that in 2010, the total revenue in India is twice that of Sweden and that the volume of data transfer is the same in both the countries. What is the percentage increase of ARDT in India if there is no change in ARDT in Sweden?
Answer the following question based on the information given below.
The data points in the figure below represent monthly income and expenditure data of individual members of the Ahuja family , the Bose family , the Coomar family , and the Dubey family . For these questions, savings is defined as
Savings = Income − Expenditure

Which family has the highest average expenditure?
Answer the following question based on the information given below.
The data points in the figure below represent monthly income and expenditure data of individual members of the Ahuja family , the Bose family , the Coomar family , and the Dubey family . For these questions, savings is defined as
Savings = Income − Expenditure
Which family has the lowest average income?
Answer the following question based on the information given below.
The data points in the figure below represent monthly income and expenditure data of individual members of the Ahuja family , the Bose family , the Coomar family , and the Dubey family . For these questions, savings is defined as
Savings = Income − Expenditure
The highest amount of savings accrues to a member of which family?
Answer the following question based on the information given below.
The data points in the figure below represent monthly income and expenditure data of individual members of the Ahuja family , the Bose family , the Coomar family , and the Dubey family . For these questions, savings is defined as
Savings = Income − Expenditure
Which family has the lowest average savings?
Answer the following question based on the information given below.
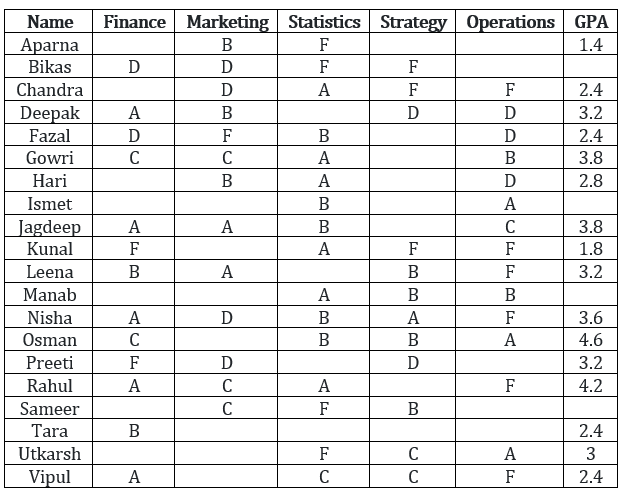
The Dean’s office recently scanned student results into the central computer system. When their character reading software cannot read something, it leaves the space blank. The scanner output reads as follows:
 âââââââ
In the grading system, A, B, C, D, and F grades fetch 6, 4, 3, 2, and 0 grade points respectively. The Grade Point Average (GPA) is the arithmetic mean of the grade points obtained in the five subjects.
For example Nisha's GPA is 3.6
Some additional facts are also known about the students’ grades. These are:
a. Vipul obtained the same grade in Marketing as Aparna obtained in Finance and Strategy.
b. Fazal obtained the same grade in Strategy as Utkarsh did in Marketing.
c. Tara received the same grade in exactly three courses.
In Operations, Tara could have received the same grade as ____________.
Answer the following question based on the information given below.
The Dean’s office recently scanned student results into the central computer system. When their character reading software cannot read something, it leaves the space blank. The scanner output reads as follows:
âââââââ
In the grading system, A, B, C, D, and F grades fetch 6, 4, 3, 2, and 0 grade points respectively. The Grade Point Average (GPA) is the arithmetic mean of the grade points obtained in the five subjects.
For example Nisha's GPA is 3.6
Some additional facts are also known about the students’ grades. These are:
a. Vipul obtained the same grade in Marketing as Aparna obtained in Finance and Strategy.
b. Fazal obtained the same grade in Strategy as Utkarsh did in Marketing.
c. Tara received the same grade in exactly three courses.
What grade did Preeti obtain in Statistics?
Answer the following question based on the information given below.
The Dean’s office recently scanned student results into the central computer system. When their character reading software cannot read something, it leaves the space blank. The scanner output reads as follows:
âââââââ
In the grading system, A, B, C, D, and F grades fetch 6, 4, 3, 2, and 0 grade points respectively. The Grade Point Average (GPA) is the arithmetic mean of the grade points obtained in the five subjects.
For example Nisha's GPA is 3.6
Some additional facts are also known about the students’ grades. These are:
a. Vipul obtained the same grade in Marketing as Aparna obtained in Finance and Strategy.
b. Fazal obtained the same grade in Strategy as Utkarsh did in Marketing.
c. Tara received the same grade in exactly three courses.
What grade did Utkarsh obtain in Finance?
Answer the following question based on the information given below.
Each point in the graph below shows the profit and turnover data for a company. Each company belongs to one of the three industries: textile, cement and steel.
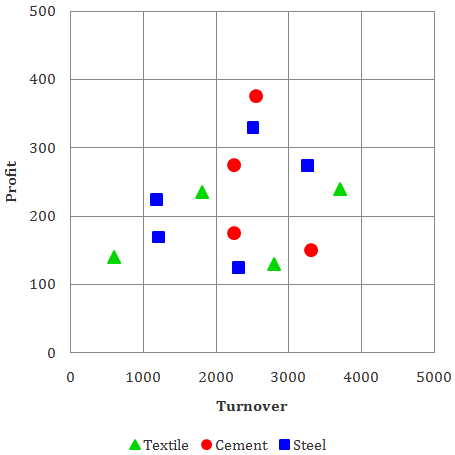
For how many companies does the profit exceed 10% of turnover?
Answer the following question based on the information given below.
Each point in the graph below shows the profit and turnover data for a company. Each company belongs to one of the three industries: textile, cement and steel.
For how many steel companies with a turnover of more than 2000 is the profit less than 300?
Answer the following question based on the information given below.
Each point in the graph below shows the profit and turnover data for a company. Each company belongs to one of the three industries: textile, cement and steel.
An investor wants to buy stock of only steel or cement companies with a turnover more than 1000 and profit exceeding 10% of turnover. How many choices are available to the investor?