Pie-Charts — CAT Previous-Year Questions
29 previous-year questions on Pie-Charts from CAT, with full solutions. Practise free — check answers as you go; sign in to save your progress.
Pie-Charts · CAT PYQs
Answer the following question based on the information given below.
The multi-layered pie-chart below shows the sales of LED television sets for a big retail electronics outlet during 2016 and 2017. The outer layer shows the monthly sales during this period, with each label showing the month followed by sales figure of that month. For some months, the sales figures are not given in the chart. The middle-layer shows quarter wise aggregate sales figures (in some cases, aggregate quarter-wise sales numbers are not given next to the quarter). The innermost layer shows annual sales. It is known that the sales figures during the three months of the second quarter (April, May, June) of 2016 form an arithmetic progression, as do the three monthly sales figures in the fourth quarter (October, November, December) of that year.

What is the percentage increase in sales in December 2017 as compared to the sales in December 2016?
Answer the following question based on the information given below.
The multi-layered pie-chart below shows the sales of LED television sets for a big retail electronics outlet during 2016 and 2017. The outer layer shows the monthly sales during this period, with each label showing the month followed by sales figure of that month. For some months, the sales figures are not given in the chart. The middle-layer shows quarter wise aggregate sales figures (in some cases, aggregate quarter-wise sales numbers are not given next to the quarter). The innermost layer shows annual sales. It is known that the sales figures during the three months of the second quarter (April, May, June) of 2016 form an arithmetic progression, as do the three monthly sales figures in the fourth quarter (October, November, December) of that year.
In which quarter of 2017 was the percentage increase in sales from the same quarter of 2016 the highest?
Answer the following question based on the information given below.
The multi-layered pie-chart below shows the sales of LED television sets for a big retail electronics outlet during 2016 and 2017. The outer layer shows the monthly sales during this period, with each label showing the month followed by sales figure of that month. For some months, the sales figures are not given in the chart. The middle-layer shows quarter wise aggregate sales figures (in some cases, aggregate quarter-wise sales numbers are not given next to the quarter). The innermost layer shows annual sales. It is known that the sales figures during the three months of the second quarter (April, May, June) of 2016 form an arithmetic progression, as do the three monthly sales figures in the fourth quarter (October, November, December) of that year.
During which quarter was the percentage decrease in sales from the previous quarter’s sales the highest?
Answer the following question based on the information given below.
The multi-layered pie-chart below shows the sales of LED television sets for a big retail electronics outlet during 2016 and 2017. The outer layer shows the monthly sales during this period, with each label showing the month followed by sales figure of that month. For some months, the sales figures are not given in the chart. The middle-layer shows quarter wise aggregate sales figures (in some cases, aggregate quarter-wise sales numbers are not given next to the quarter). The innermost layer shows annual sales. It is known that the sales figures during the three months of the second quarter (April, May, June) of 2016 form an arithmetic progression, as do the three monthly sales figures in the fourth quarter (October, November, December) of that year.
During which month was the percentage increase in sales from the previous month’s sales the highest?
Answer the following question based on the information given below.
Answer the questions on the basis of the following charts.
(Note: Availability is defined as production less export.)
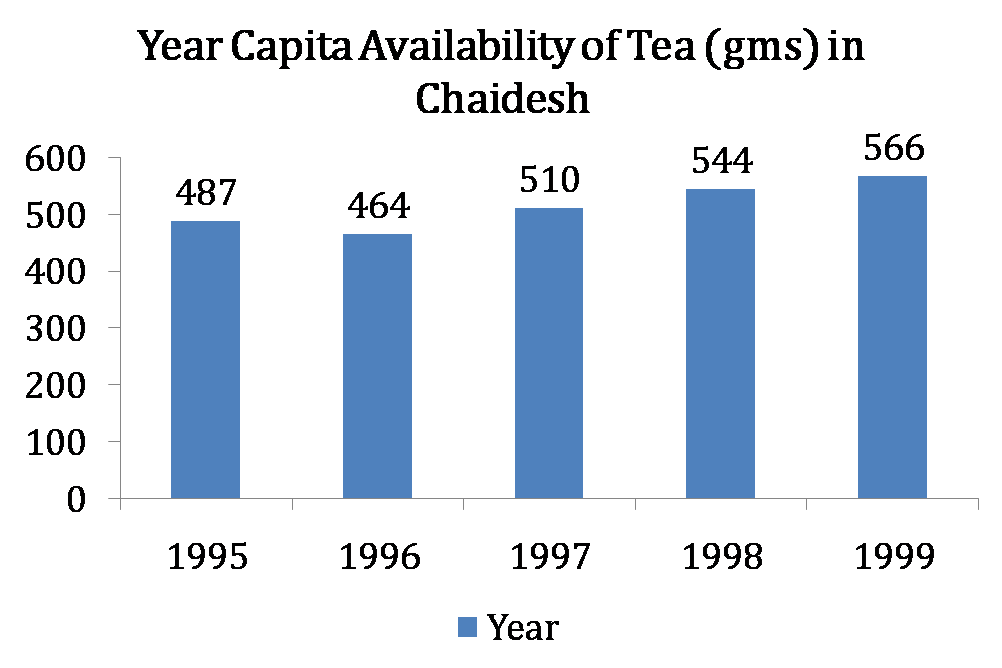

In which year during the period 1996-1999 was Chaidesh’s export of tea, as a proportion of tea produced, the highest?
Answer the following question based on the information given below.
Answer the questions on the basis of the following charts.
(Note: Availability is defined as production less export.)
In which of the following years was the population of Chaidesh the lowest?
Answer the following question based on the information given below.
Answer the questions on the basis of the following charts.
(Note: Availability is defined as production less export.)
The area under tea cultivation continuously decreased in all four years from 1996 to 1999, by 10%, 7%, 4% and 1% respectively. In which year was tea productivity (production per unit of area) the highest?
Answer the following question based on the information given below.
Chart A represents the distribution by value of top 6 suppliers of MFA Textiles in 1995. The total value of Chart A is 5760 million Euro.
Chart B represents the distribution by quantity of top 6 suppliers of MFA Textiles in 1995. The total value of Chart B is 1.05 million tons.


The country which has the highest average price is:
Answer the following question based on the information given below.
Chart A represents the distribution by value of top 6 suppliers of MFA Textiles in 1995. The total value of Chart A is 5760 million Euro.
Chart B represents the distribution by quantity of top 6 suppliers of MFA Textiles in 1995. The total value of Chart B is 1.05 million tons.
The average price (Euro per kg) in Turkey is roughly:
Answer the following question based on the information given below.
Figure 1 shows the amount of work distribution, in man-hours, for a software between offshore and onsite activities. Figure 2 shows the estimated and actual work effort involved in the different offshore activities in the same company during the same period. [Note: Onsite refers to work performed at the customer's premise and offshore refers to work performed at the developer's premise.]

Which of the work requires as many man-hours as that spent in coding?
Answer the following question based on the information given below.
Figure 1 shows the amount of work distribution, in man-hours, for a software between offshore and onsite activities. Figure 2 shows the estimated and actual work effort involved in the different offshore activities in the same company during the same period. [Note: Onsite refers to work performed at the customer's premise and offshore refers to work performed at the developer's premise.]
Roughly what percentage of the total work is carried out onsite?
Answer the following question based on the information given below.
Figure 1 shows the amount of work distribution, in man-hours, for a software between offshore and onsite activities. Figure 2 shows the estimated and actual work effort involved in the different offshore activities in the same company during the same period. [Note: Onsite refers to work performed at the customer's premise and offshore refers to work performed at the developer's premise.]
The total effort in man-hours spent onsite is nearest to which of the following?
Answer the following question based on the information given below.
Figure 1 shows the amount of work distribution, in man-hours, for a software between offshore and onsite activities. Figure 2 shows the estimated and actual work effort involved in the different offshore activities in the same company during the same period. [Note: Onsite refers to work performed at the customer's premise and offshore refers to work performed at the developer's premise.]
If the total working hours were 100, which of the following tasks will account for approximately 50 hours?
Answer the following question based on the information given below.
Figure 1 shows the amount of work distribution, in man-hours, for a software between offshore and onsite activities. Figure 2 shows the estimated and actual work effort involved in the different offshore activities in the same company during the same period. [Note: Onsite refers to work performed at the customer's premise and offshore refers to work performed at the developer's premise.]
If 50 percent of the offshore work were to be carried out onsite, with the distribution of effort between the tasks remaining the same, the proportion of testing carried out offshore would be
Answer the following question based on the information given below.
Figure 1 shows the amount of work distribution, in man-hours, for a software between offshore and onsite activities. Figure 2 shows the estimated and actual work effort involved in the different offshore activities in the same company during the same period. [Note: Onsite refers to work performed at the customer's premise and offshore refers to work performed at the developer's premise.]
If 50 percent of the offshore work were to be carried out onsite, with the distribution of effort between the tasks remaining the same, which of the following is true of all work carried out onsite?
Answer the following question based on the information given below.
The questions are based on the pie charts given below. Chart 1 shows the distribution of twelve million tons of crude oil transported through different modes over a specific period of time. Chart 2 shows the distribution of the cost of transporting this crude oil. The total cost was Rs. 30 million.
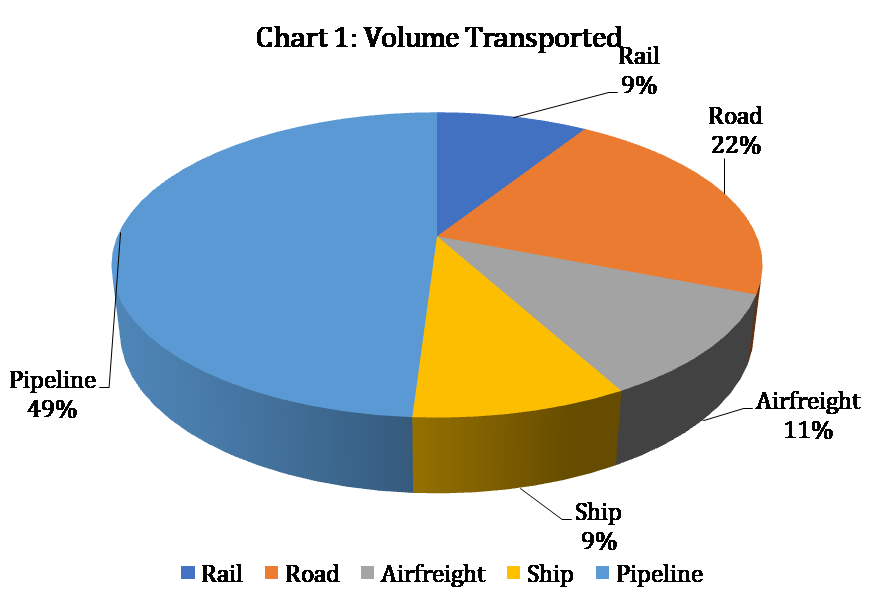

The cost in rupees per ton of oil moved by rail and road happens to be roughly
Answer the following question based on the information given below.
The questions are based on the pie charts given below. Chart 1 shows the distribution of twelve million tons of crude oil transported through different modes over a specific period of time. Chart 2 shows the distribution of the cost of transporting this crude oil. The total cost was Rs. 30 million.
From the charts given, it appears that the cheapest mode of transport is
Answer the following question based on the information given below.
The questions are based on the pie charts given below. Chart 1 shows the distribution of twelve million tons of crude oil transported through different modes over a specific period of time. Chart 2 shows the distribution of the cost of transporting this crude oil. The total cost was Rs. 30 million.
If the costs per ton of transport by ship, air and road are represented by P, Q and R respectively, which of the following is true?
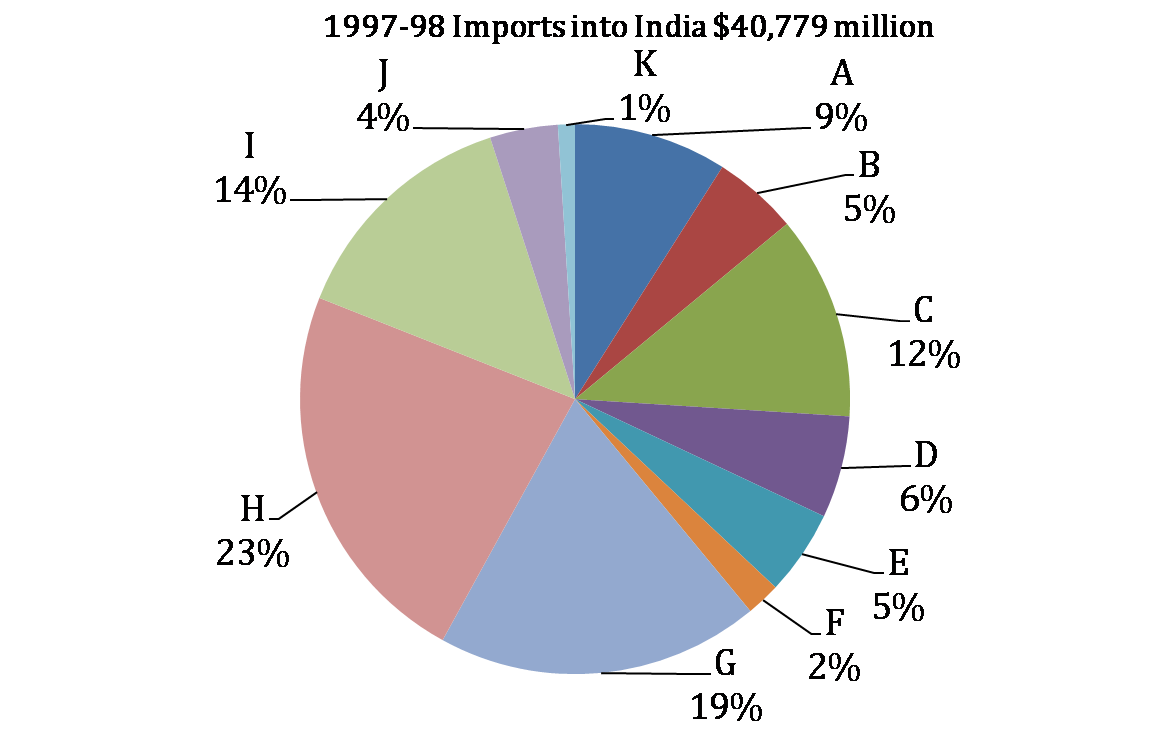
Directions: Answer the questions based on the following information
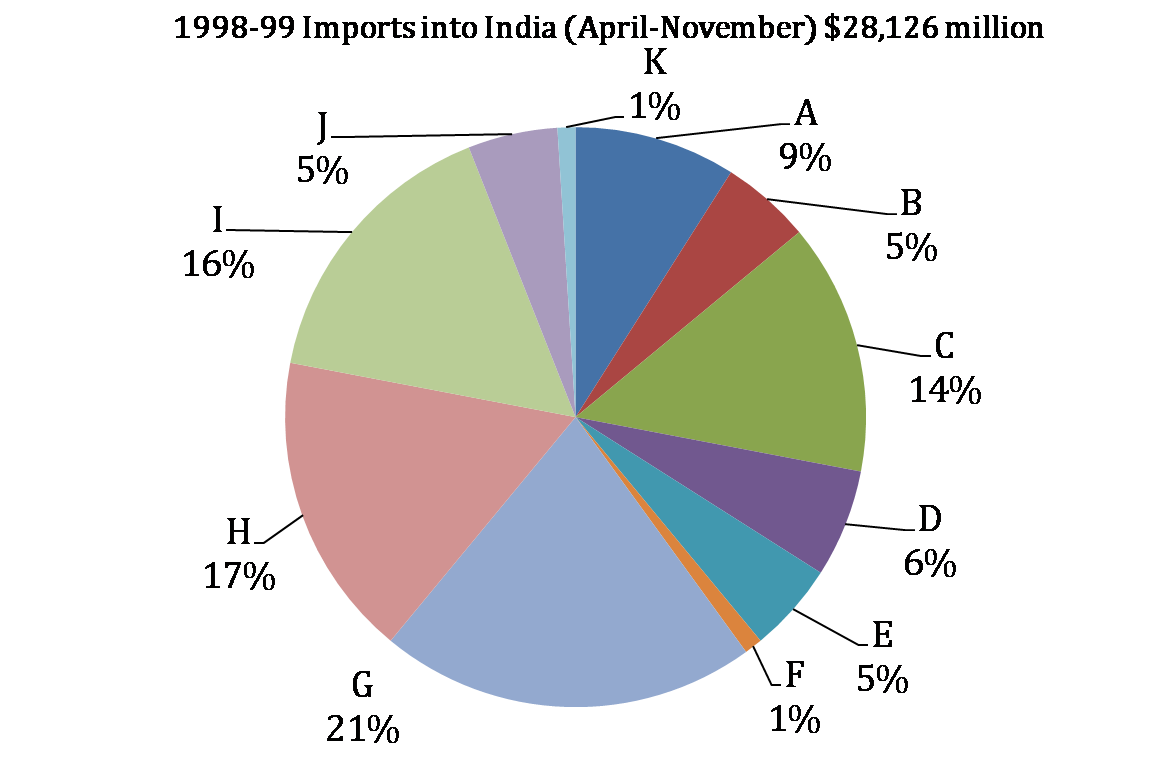
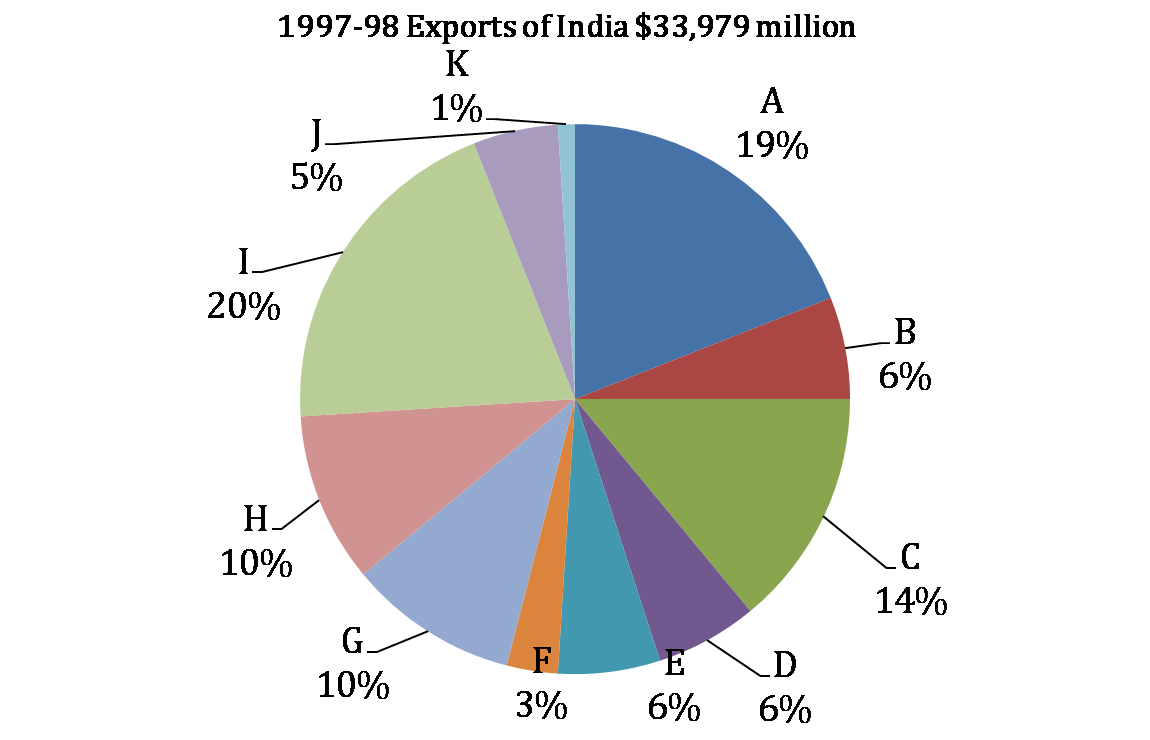
Consider the information provided in the figure below relating to India’s foreign trade in 1997-98 and the first eight months of 1998-99. Total trade with a region is defined as the sum of exports and imports from that region. Trade deficit is defined as the excess of imports over exports. Trade deficit may be negative.
A.USA G. Other East European countries
B. Germany H. OPEC
C. Other EU I. Asia
D.UK J. Other LDCs
E. Japan K. Others
F. Russia
| Source of Imports | |
 |
 |
| Destination of exports | |
 |
 |
What is the region with which India had the highest total trade in 1997-98?
Directions: Answer the questions based on the following information
Consider the information provided in the figure below relating to India’s foreign trade in 1997-98 and the first eight months of 1998-99. Total trade with a region is defined as the sum of exports and imports from that region. Trade deficit is defined as the excess of imports over exports. Trade deficit may be negative.
A.USA G. Other East European countries
B. Germany H. OPEC
C. Other EU I. Asia
D.UK J. Other LDCs
E. Japan K. Others
F. Russia
| Source of Imports | |
|
|
| Destination of exports | |
|
|
In 1997-98 the amount of Indian exports, million US dollars, to the region with which India had the lowest total trade, is approximately
Directions: Answer the questions based on the following information
Consider the information provided in the figure below relating to India’s foreign trade in 1997-98 and the first eight months of 1998-99. Total trade with a region is defined as the sum of exports and imports from that region. Trade deficit is defined as the excess of imports over exports. Trade deficit may be negative.
A.USA G. Other East European countries
B. Germany H. OPEC
C. Other EU I. Asia
D.UK J. Other LDCs
E. Japan K. Others
F. Russia
| Source of Imports | |
|
|
| Destination of exports | |
|
|
In 1997-98, the trade deficit with respect to India, billion US dollars, for the region with the highest trade deficit with respect to India, is approximately equal to
Directions: Answer the questions based on the following information
Consider the information provided in the figure below relating to India’s foreign trade in 1997-98 and the first eight months of 1998-99. Total trade with a region is defined as the sum of exports and imports from that region. Trade deficit is defined as the excess of imports over exports. Trade deficit may be negative.
A.USA G. Other East European countries
B. Germany H. OPEC
C. Other EU I. Asia
D.UK J. Other LDCs
E. Japan K. Others
F. Russia
| Source of Imports | |
|
|
| Destination of exports | |
|
|
What is the region with the lowest trade deficit with India in 1997-98?
Directions: Answer the questions based on the following information
Consider the information provided in the figure below relating to India’s foreign trade in 1997-98 and the first eight months of 1998-99. Total trade with a region is defined as the sum of exports and imports from that region. Trade deficit is defined as the excess of imports over exports. Trade deficit may be negative.
A.USA G. Other East European countries
B. Germany H. OPEC
C. Other EU I. Asia
D.UK J. Other LDCs
E. Japan K. Others
F. Russia
| Source of Imports | |
|
|
| Destination of exports | |
|
|
Additional directions: Assume that the average monthly exports from India and imports to India during the remaining four months of 1998-99 would be the same as that for the first eight months of the year.
What is the region to which India’s exports registered the highest percentage growth between 1997-98 and 1998-99?
Directions: Answer the questions based on the following information
Consider the information provided in the figure below relating to India’s foreign trade in 1997-98 and the first eight months of 1998-99. Total trade with a region is defined as the sum of exports and imports from that region. Trade deficit is defined as the excess of imports over exports. Trade deficit may be negative.
A.USA G. Other East European countries
B. Germany H. OPEC
C. Other EU I. Asia
D.UK J. Other LDCs
E. Japan K. Others
F. Russia
| Source of Imports | |
|
|
| Destination of exports | |
|
|
Additional directions: Assume that the average monthly exports from India and imports to India during the remaining four months of 1998-99 would be the same as that for the first eight months of the year.
What is the percentage growth rate in India’s total trade deficit between 1997-98 and 1998-99?
Direction: Answer the questions based on the following piecharts.


The operating profit in 1991-92 increased over that in 1990-91 by
Direction: Answer the questions based on the following piecharts.
The interest burden in 1991-92 was higher than that in 1990-91 by
Direction: Answer the questions based on the following piecharts.
If on an average, 20% rate of interest was charged on borrowed funds, then the total borrowed funds used by this company in the given two years amounted to
Direction: Answer the questions based on the following piecharts.
The retained profit in 1991-92, as compared to that in 1990-91 was
Direction: Answer the questions based on the following piecharts.
The equity base of these companies remained unchanged. Then the total dividend earning by the share holders in 1991-92 is